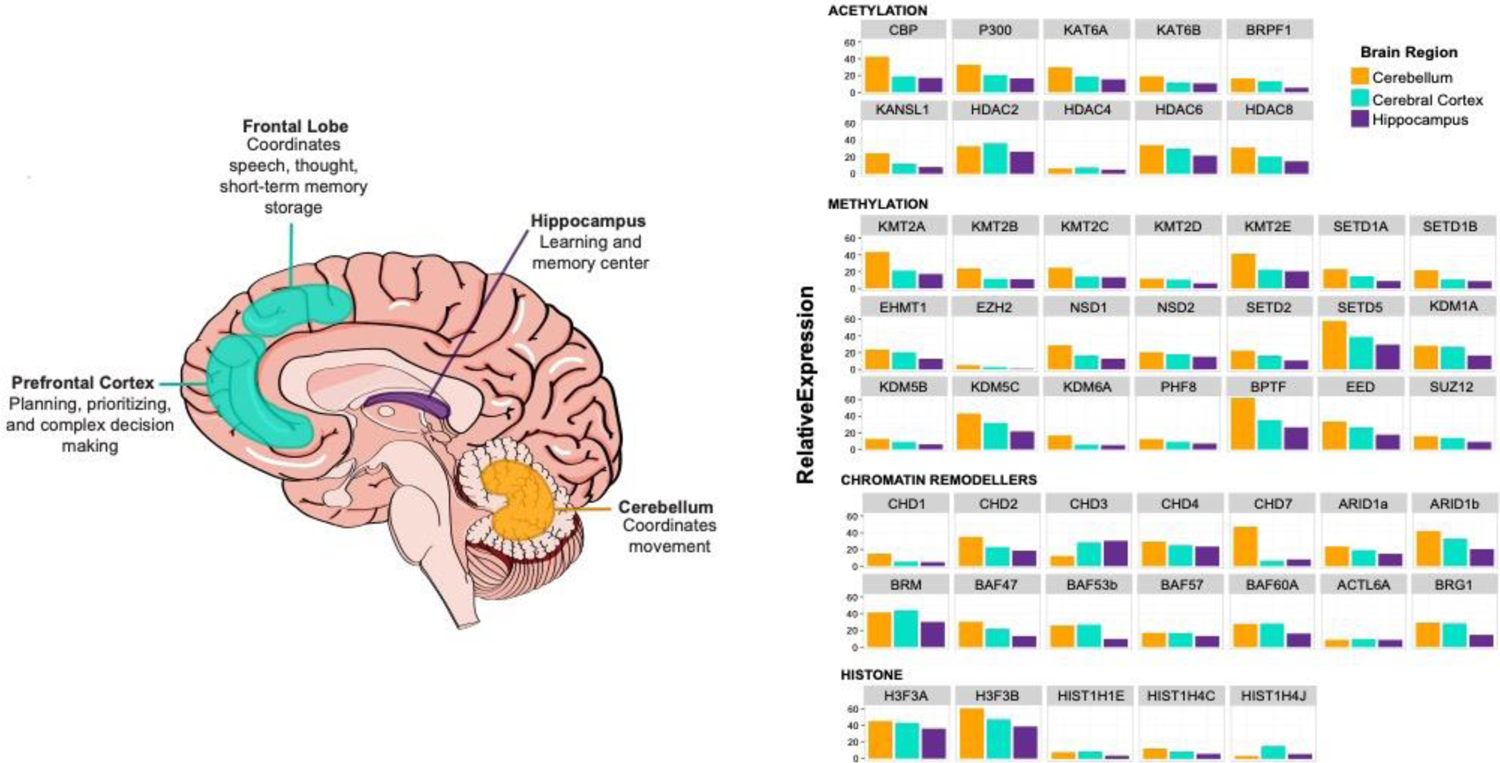
FIGURE 3:

Spatial expression of epigenetic factors dysregulated in NDD. (left) Graphical representation of brain regions in which most genes are highly expressed and their respective functions. (right) Expression in these three regions according to Consensus normalized expression (NX) levels on Protein atlas. This dataset was created by combining two transcriptomic datasets (GTEx and FANTOM5).
