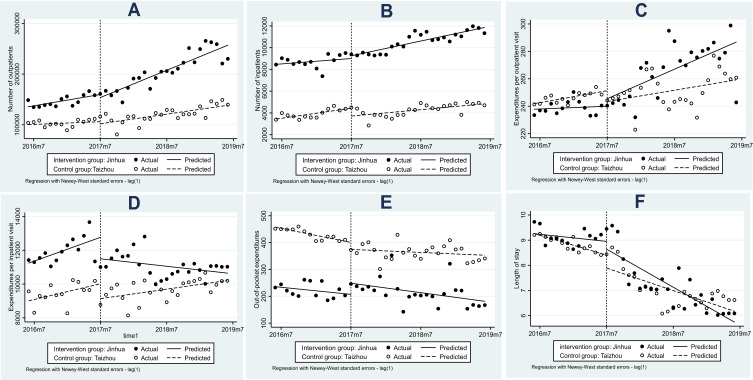
Figure 3.
Time trend of volume, expenditure and efficiency by months and group in tertiary hospitals. (A) and (B) are number of outpatients and inpatients in tertiary hospitals; (C) and (D) are outpatient and inpatient expenditures per visit in tertiary hospitals; (E) is OOP payments per visit in tertiary hospitals; (F) is LOS in tertiary hospitals.

