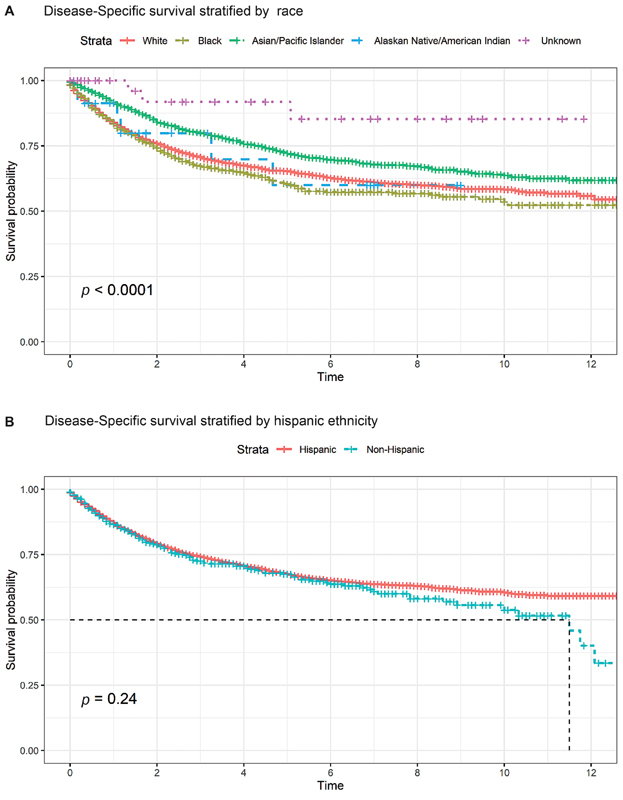
Fig. 2.

( A ) Kaplan–Meier curve stratified by race, with log-rank statistic displayed. Median survival was not reached over follow-up period. Time is measured by years. ( B ) Kaplan–Meier curve stratified by Hispanic ethnicity, with log-rank statistic displayed. Time is measured in years.
