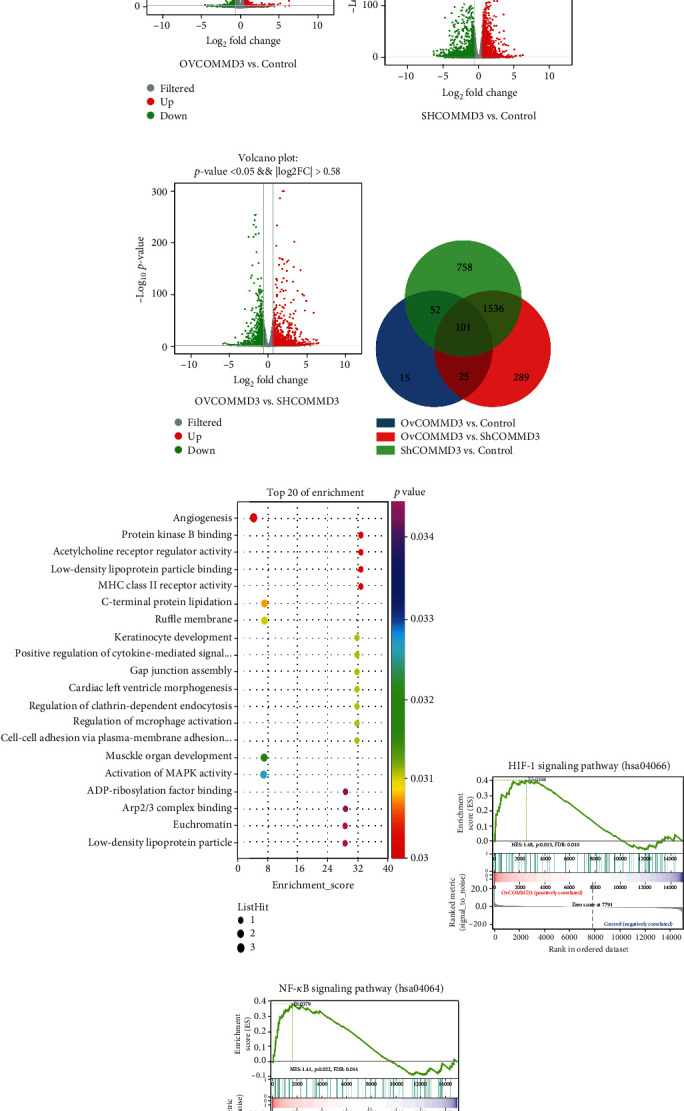
Figure 2.

COMMD3 modulates the DEGs among OvCOMMD3, control, and ShCOMMD3 in SK-Hep1 cells. (a–c) The volcanic maps indicated the DEGs among the three comparative groups. The red color represents upregulated DEGs, the blue color represents downregulated DEGs, and the gray color represents the non-DEGs; log2FC ≥ 1.5 and P < 0.001. (d) Venn diagram of DEGs in control vs. OvCOMMD3, control vs. ShCOMMD3, and ShCOMMD3 vs. OvCOMMD3; log2FC ≥ 1.5 and P ≤ 0.01. (e) Bubble diagram showed GO functional enrichment analysis. The Q-value is the calibration value for the P value. (f–g) GSEA for the HIF1α and NF-κB pathway. A nominal P < 0.05 and false discovery rate (FDR) < 0.25 were set as statistically significant thresholds.
