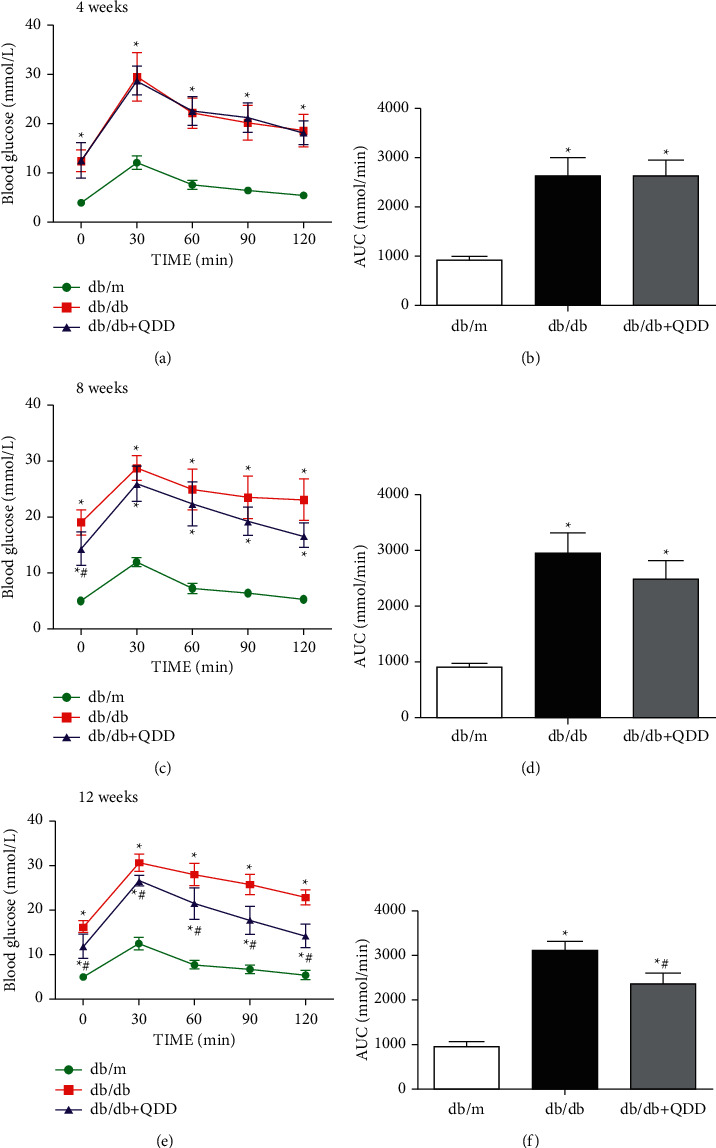
Figure 3.

Effects of QDD on OGTT and AUC in db/db mice. (a), (c), (e) The levels of OGTT (n = 6) were detected by a glucometer. (b), (d), (f) Based on the OGTT results, the AUC was calculated (n = 6). Data are presented as the mean ± SD values. ∗P < 0.05 vs. db/m; #P < 0.05 vs. db/db. AUC, Area under the curve; OGTT, Oral glucose tolerance test.
