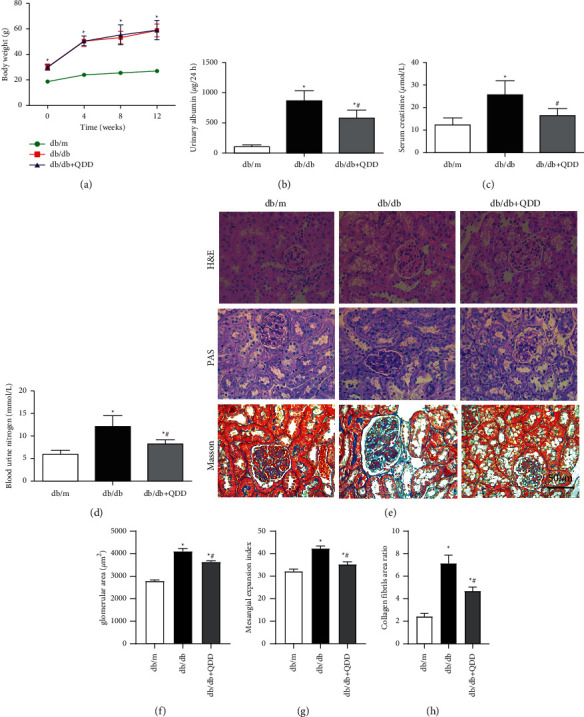
Figure 4.

QDD improves kidney damage in db/db mice. (a) The body weights of mice were recorded every 4 weeks from 0 weeks to 12 weeks (n = 6). (b) The levels of urinary albumin (n = 6) were detected by an automatic biochemistry analyser. (c) The levels of serum creatinine (n = 6) were detected by an automatic biochemistry analyser. (d) The levels of blood urea nitrogen (n = 6) were detected by an automatic biochemistry analyser. (e) The pathologic changes in renal tissues were observed via HE, PAS and masson staining. (f) Glomerular area. (g, h) Quantifications of PAS and masson staining. Data are presented as the mean ± SD values. ∗P < 0.05 vs. db/m; #P < 0.05 vs. db/db.
