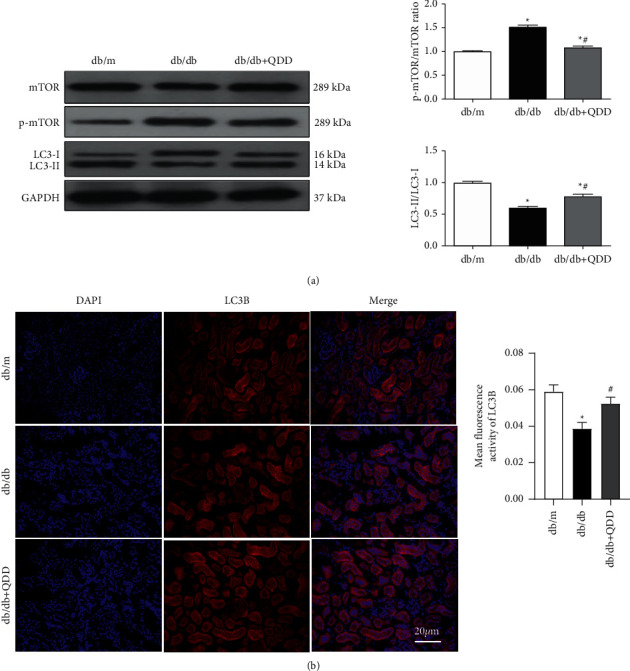
Figure 6.

The effect of QDD on autophagy-related proteins in the kidneys of db/db mice. (a) The expression and densitometry analysis of mTOR, p-mTOR, and LC3II/LC3I (n = 3). (b) The expression of LC3B was determined via immunofluorescence. The fluorescence intensity of LC3B was analyzed by Image J software. The nucleus staining is shown in blue, LCB staining is shown in red, the bright red spot is the LCB fluorescent spot (white arrows), scale bar = 20 μm. Data are presented as the mean ± SD values. ∗P < 0.05 vs. db/m; #P < 0.05 vs. db/db.
