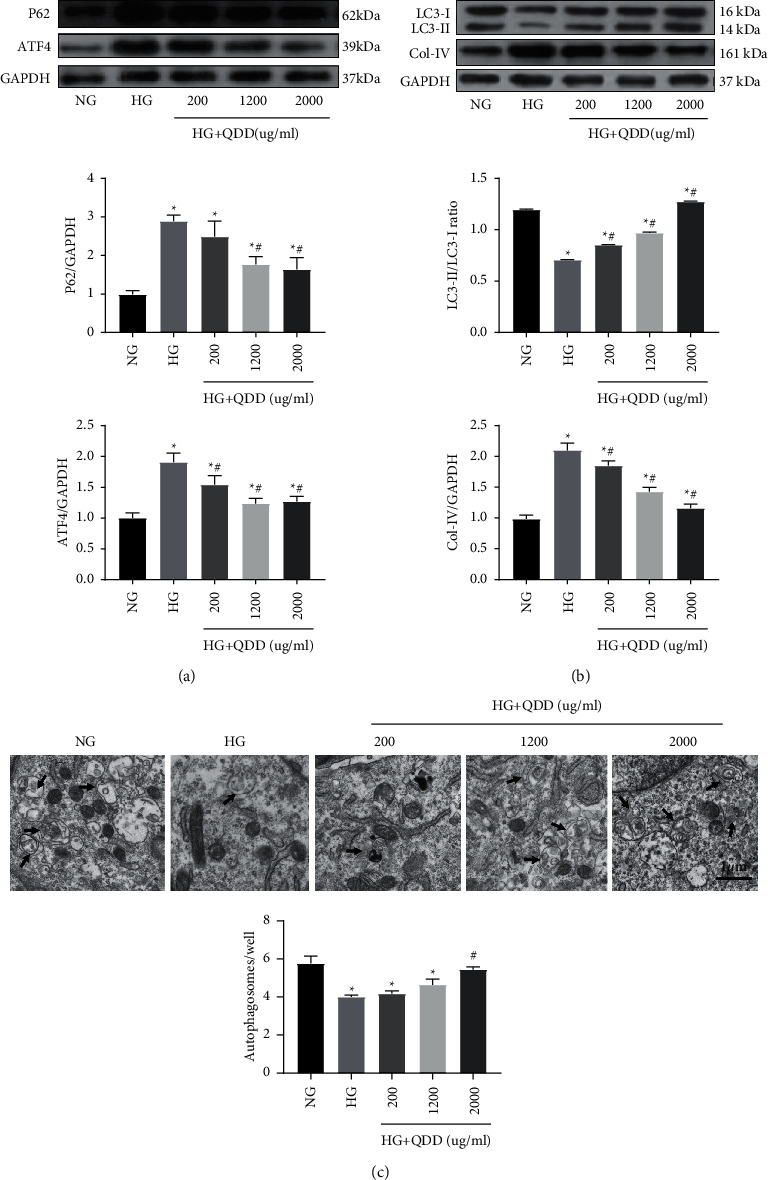
Figure 8.

The effect of QDD on ATF4, fibrosis and autophagy in HG-treated NRK-52E cells. (a) Expression and densitometry analysis of P62 and ATF4 (n = 3). (b) The expression and densitometry analysis of LC3 and Col-IV (n = 3). (c) Representative electronic micrographs and summarized data showing the number of autophagosomes/well in different groups (autophagosomes were counted in 10 randomly selected fields). Autophagic vacuoles are indicated with arrows. Data are presented as the mean ± SD values. ∗P < 0.05 vs. NG; #P < 0.05 vs. HG. NG: low glucose; HG: high glucose.
