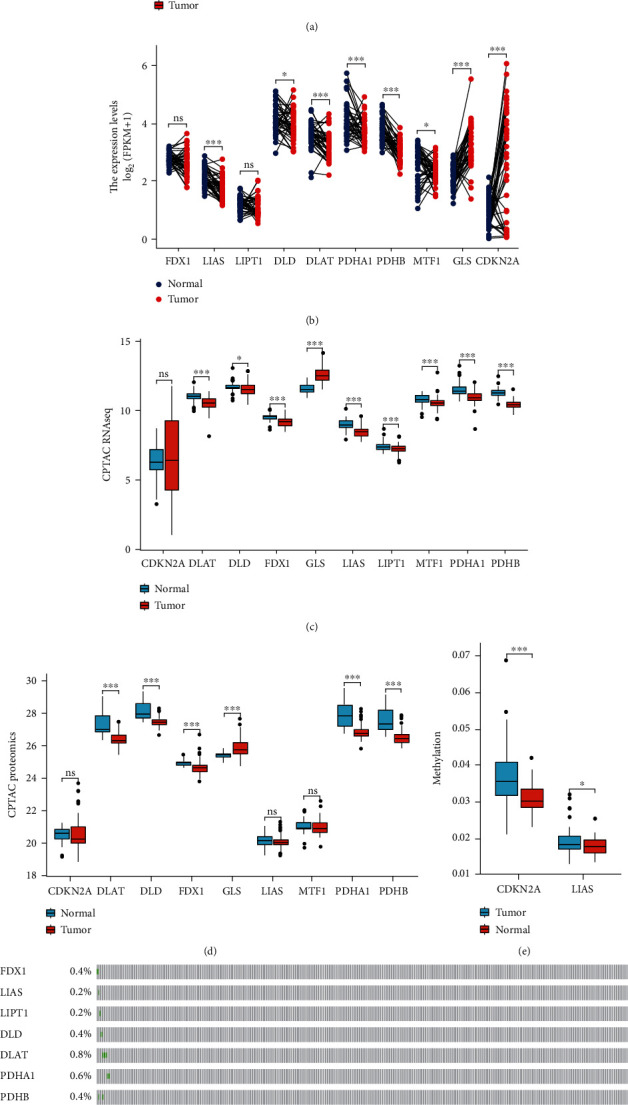
Figure 1.

Expression profile of cuproptosis-related genes. (a), (b) Box plots present the differentially expressed cuproptosis-related genes between HNSCC and normal sample. (c), (d) Box plots validated the expression profile from CPTAC RNAseq and proteomics data. (e) The methylation degree of CDKN2A and LIAS. (f) Mutation status.
