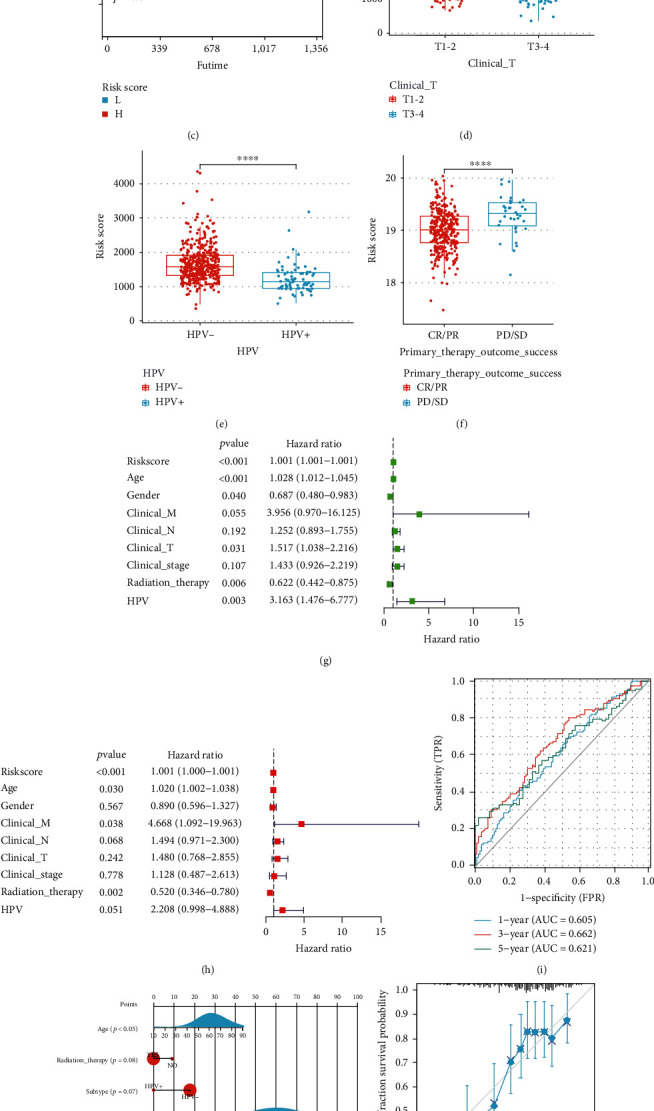
Figure 2.

Construction of CRGs prognostic model and survival analysis. (a) The 7 CRGs used for construction of the gene risk model. (b), (c) In TCGA and CPTAC cohorts, low-risk group patients had favorable OS rates compared with those in the high-risk group. (d–f) Correlation analysis of risk score and clinical characteristics. (g), (h) Cox analyses, univariate and multivariate, showing the independent prognostic significance of the risk signature in predicting the OS of HNSCC patients in the TCGA cohort. (i) The ROC curve for 1-, 3-, and 5-year OS of HNSCC patients in the TCGA cohorts. (j) The predicted the 1-year, 3-year, and 5-year OS of HNSCC patients based on the constructed nomogram. (k), (l) Calibration curve of the OS predicted by the nomogram model. The dashed diagonal line represents the ideal nomogram. (m) DCA curve for 1- and 3-year prognosis.
