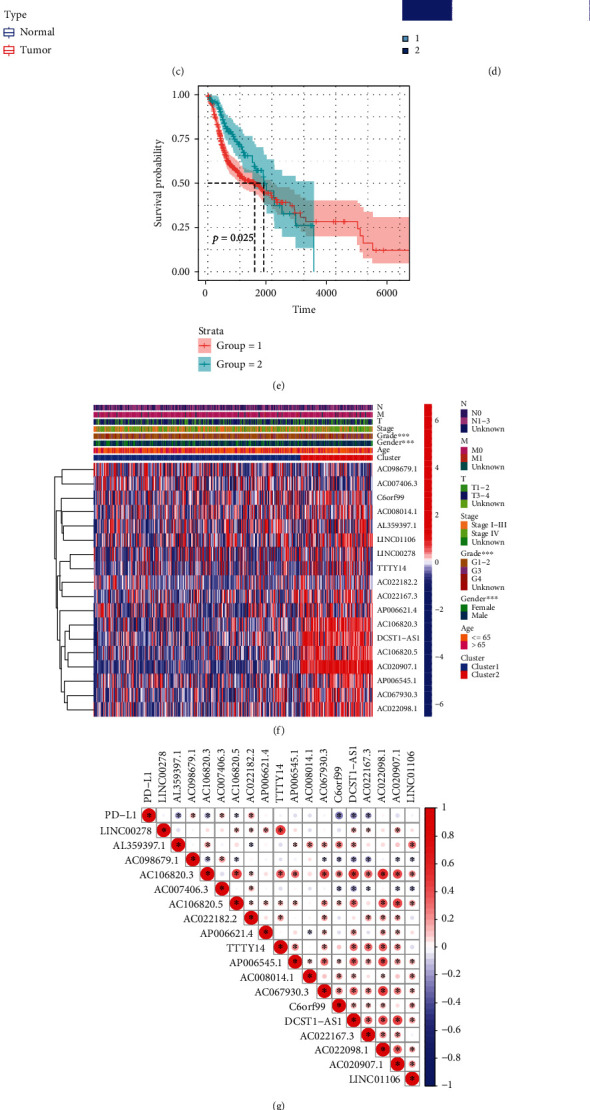
Figure 6.

Identification of cuproptosis-associated 18-lncRNAs with prognostic value and immune response in HNSCC patients. (a) A coexpression network of cuproptosis-related lncRNAs and genes was constructed and visualized. (b) 18 independent prognostic predictor lncRNA signatures with different expressions of HNSCC. (c) Box plot presents the differentially expressed cuproptosis-related lncRNAs between HNSCC and normal sample. (d) 501 HNSCC samples from the TCGA cohort were classified into 2 clusters using an unsupervised clustering method. (e) The Kaplan-Meier curve showed that patients in cluster 2 displayed a shorter overall survival than those in cluster 1. (f) Heat map of the prognostic characteristics and clinicopathological correlation of cuproptosis-related lncRNAs. (g) Correlation analysis of PD-L1 expression and 18 independent prognostic predictor lncRNA signatures. (h) Violin plot of immune-infiltrating lymphocytes between cluster 1 and cluster 2. (i) Box plot presents the differentially infiltrated CD8 T cells between cluster 1 and cluster 2. (j) Differences in ESTIMATE score between cluster 1 and cluster 2.
