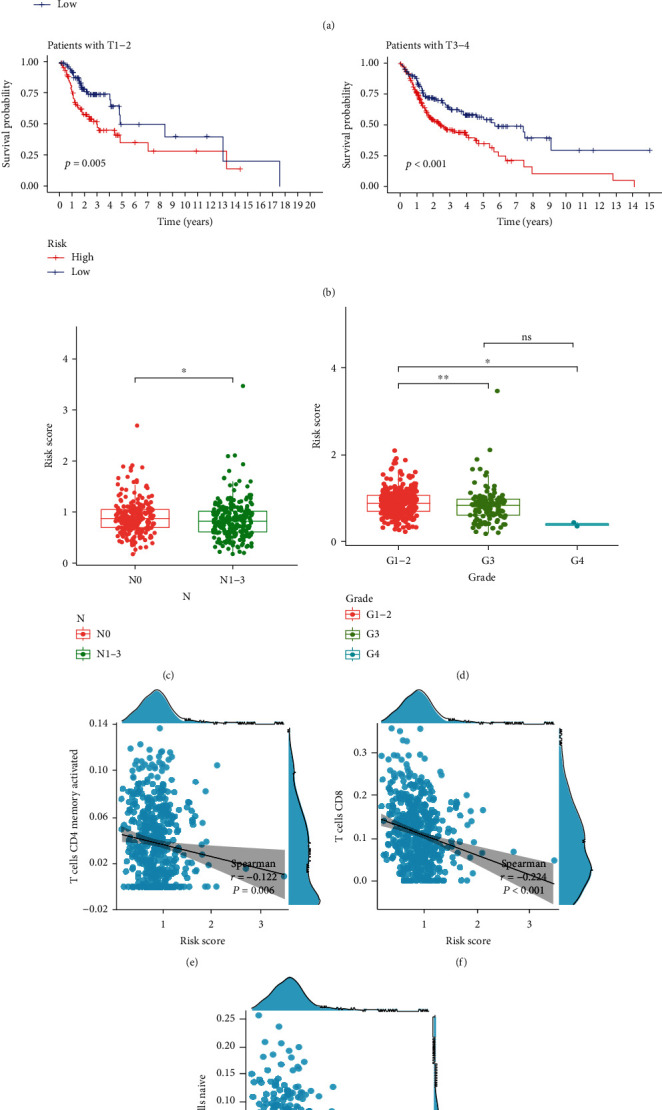
Figure 8.

Prognostic value of cuproptosis-associated lncRNA signature and the correlation with relevant immune cells. (a), (b) The Kaplan-Meier curve showed that patients in different groups ((a) patients with different age; (b) patients with T stage) with high risk displayed a shorter overall survival than those with low risk. (c), (d) Correlation analysis of lncRNA-related risk score and clinical characteristics. (e)–(g) lncRNA-related risk score was inversely correlated with CD4 memory activated T cells (e), CD8 T cells (f), and naive B cells (g).
