
Figure 2.
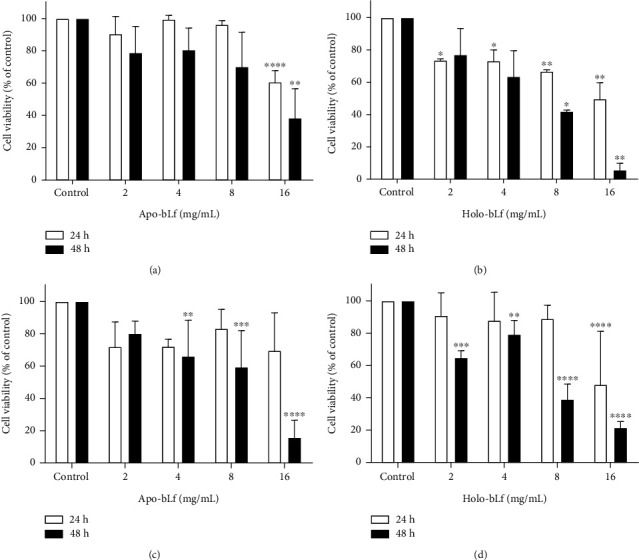
bLf induces cell death in the DU-145 cell line. DU-145 cells were treated for 24 h and 48 h with 2, 4, 8, and 16 mg/mL of apo-bLf and holo-bLf. In the negative control, the culture medium was used. Values were plotted as percentages concerning the negative control, which represents 100% of viability. (a) MTT assay and apo-bLf treatment; (b) MTT assay and holo-bLf treatment; (c) trypan blue exclusion and apo-bLf treatment; (d) trypan blue exclusion and holo-bLf treatment. Graphs (a) and (b) represent two separate experiments with replicates. Graphs (c) and (d) represent three separate experiments. The experiment is expressed as mean ± SD. Significant differences between untreated and treated cells were compared using the one-way ANOVA test, with Bonferroni post hoc test (∗p < 0.05; ∗∗p < 0.01; ∗∗∗p < 0.001; ∗∗∗∗p < 0.0001).