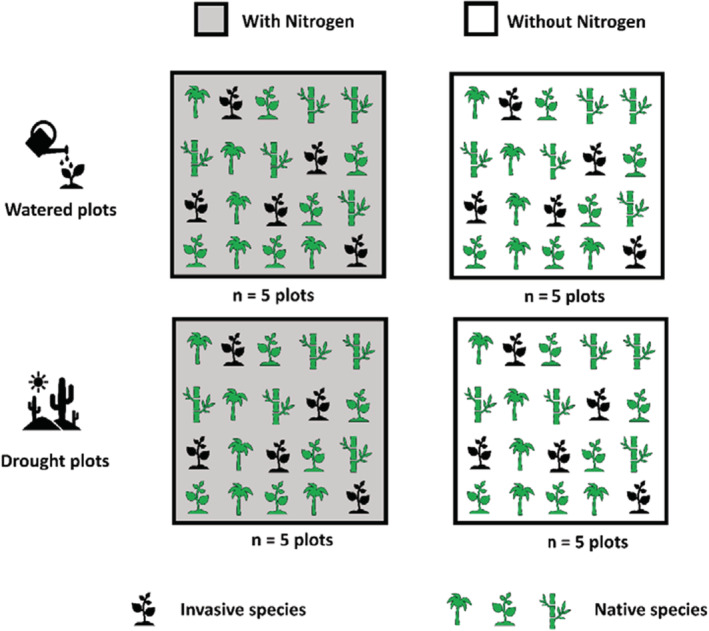
FIGURE 1.

Scheme of the experimental design. A total of 20 plots were cultivated, each plot has four species (one invasive [black] and three native species [green]) with five individuals per species (n = 20 individuals/plot). The treatments were control, drought, N‐addition, and drought + N (n = 5 plots per treatment).
