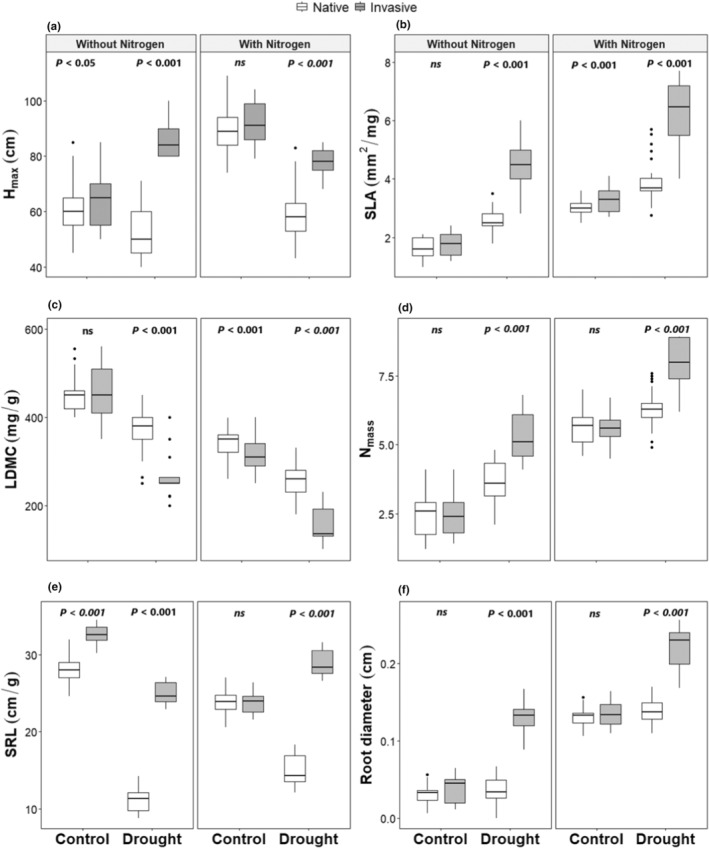
FIGURE 4.

Effect of drought and nutrient application on (a) maximum height of the plants (Hmax), (b) specific leaf area (SLA), (c) leaf dry matter content (LDMC), (d) leaf nitrogen content (Nmass), (e) specific root length (SRL), and (f) root diameter of invasive and native species. Numbers are p values of the statistically significant differences between indicated groups based on pairwise comparisons using Tukey's multiple‐comparison test (ns, non‐significant differences).
