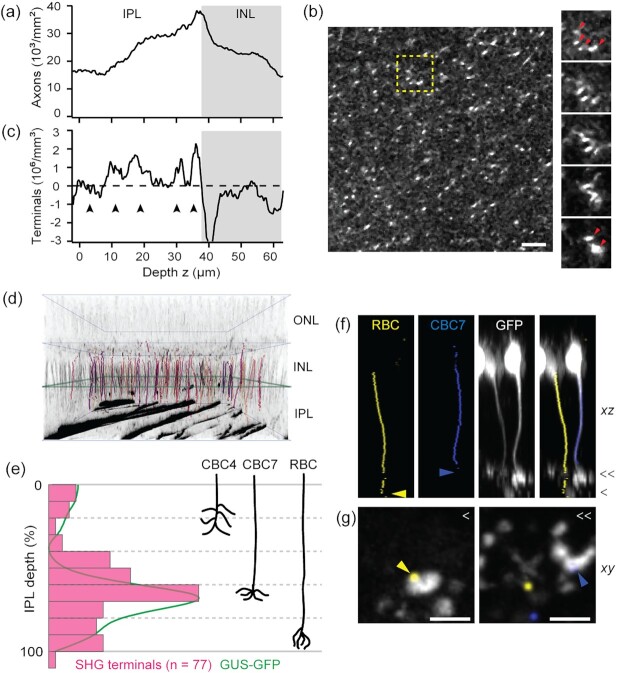
Fig. 3.
Quantification of the bipolar cell axons. (a) The density of bipolar cell axons. (b) A lateral section of the IPL. Right panels are fly-through sections corresponding to the dashed box with bipolar cell axons converging into the interstitial space of the INL (arrowheads). Scale bar, 10 µm. (c) The number of bipolar cell axon terminals, i.e., the derivative of (a), exhibits an internal structure of five layers (arrowheads). (d) 3D rendering of the GUS+ subpopulation of single SHG axons (colored and overlaid with grayscale SHG), identified by the overlap with GFP at zero IPL (green square). (e) The distribution of GUS+ SHG axon terminals (n = 77, magenta) and the mean GFP profile (green). Right, the depths of three GUS+ species (CBC4, 7, and RBC) for comparison. (f and g) GFP+ axon traces overlaid with GFP images, confirming the IPL depth and the characteristic morphology of RBC and CBC7 axon terminals. Scale bars, 5 µm.

