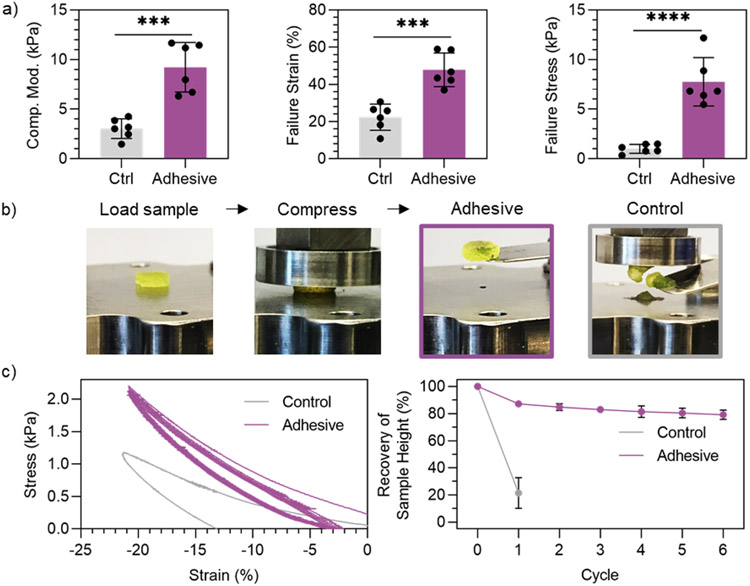
Figure 3.
Compression testing of granular hydrogels. a) Quantified compressive moduli (5% to 10% strain, left), failure strain (center), and failure stress (right) of adhesive granular hydrogels and controls at 1 h post-jamming. b) Macroscopic images of loading and compressing granular hydrogel samples (left) and the condition of the samples after loading to 20% strain (right). c) Representative behavior of granular hydrogels upon cyclic loading to 20% compressive strain followed by return to 0 N (left), and quantified recovery of sample height after cyclic compressive loading (right). Data is presented as mean ± standard deviation, with a sample size of n = 6. Statistical analysis performed using a one-way ANOVA. ***p<0.001, ****p<0.0001.

