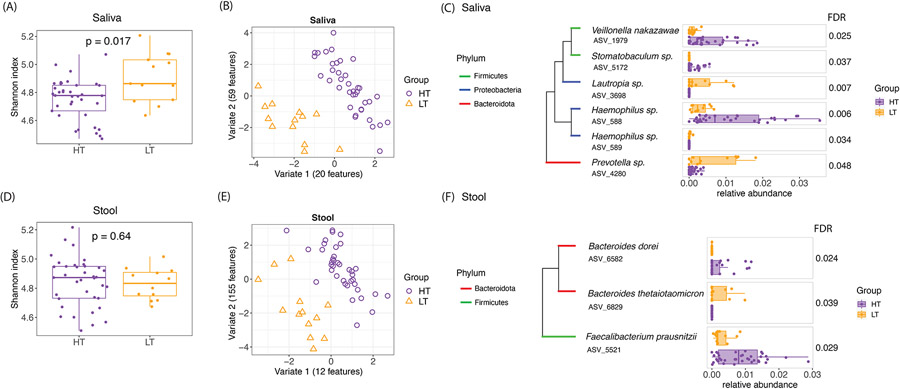
Figure 2: Distinct saliva and stool microbiomes in children with high vs. low threshold peanut allergy.
(A) Alpha diversity (Shannon index) of the saliva microbiome showed significant differences by Wilcoxon test between the high and low threshold children. Higher Shannon Index indicates higher alpha diversity. (B) SPLSDA of saliva microbiome composition showed separations between the high and low threshold children. The number of ASVs contributing to each of the first two variates are shown. (C) Saliva ASVs from SPLSDA that were differentially abundant between high and low threshold groups (FDR≤0.05) are shown. The phylogenetic trees show the taxonomic relationships between these taxa. (D), (E), and (F) show the equivalent findings for stool microbiome in these children.

