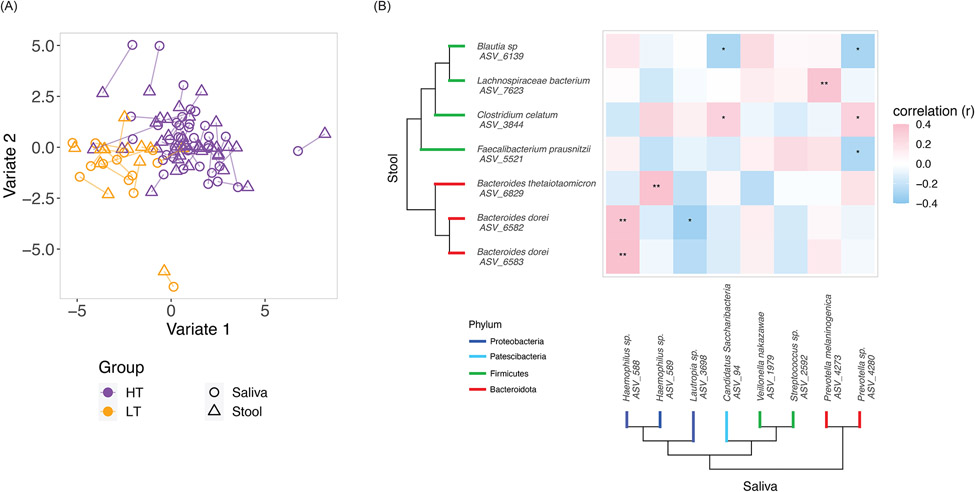
Fig.4. Correlations between saliva and stool microbiomes in peanut allergic children.
(A) Block SPLSDA was used to analyze correlations between saliva and stool microbiomes with respect to the high and low threshold groups. The identified variates maximized covariance between saliva and stool microbiome as well as separation between the high and low threshold groups. Lines connect saliva and stool samples from the same subject. 100 saliva ASVs and 155 stool ASVs contributed to Variate 1; 25 saliva taxa and 5 stool taxa contributed to Variate 2. (B) Saliva and stool taxa from the block SPLSDA that were differentially abundant (FDR≤0.05) between the high and low threshold groups were selected for Spearman correlation. Asterisks indicate Spearman FDR: * for FDR≤0.05 and ** for FDR≤0.01. The phylogenetic trees show the taxonomic relationships between the taxa.

