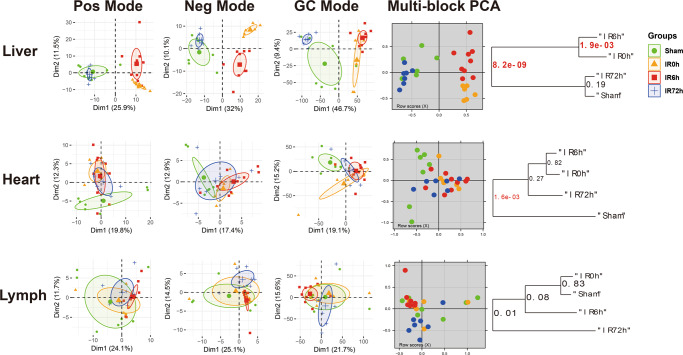
Fig. 2. IIR affected metabolomic profiles of intestinal and remote organs that showed three distinct patterns during IIR (selected representatives: liver, heart, lymph).
The first three columns are the principal component analysis (PCA) score plots derived from the LC/MS (ESI+), LC/MS (ESI−), and GC/MS metabolite data, respectively. And the fourth column illustrates the multiblock principal component analysis of the data fusion of LC/MS and GC/MS. Plots in the fifth column are metabolic tree diagrams corresponding to the multiblock-PCA score plots using Mahalanobis distances, with p values for the null hypothesis shown at each branch. The first two principal components (Dim1 and Dim2) were estimated as sufficiently well represented by the principal plan generated by each PCA. The value of p < 0.01 was considered to be significantly different, which were marked in red. Green symbols correspond to Sham groups, yellow symbols to IR0h groups, red ones to IR6h groups and blue ones to IR72h groups. Pos mode: liquid chromatography-mass spectrometry (ESI+); Neg mode: liquid chromatography-mass spectrometry (ESI−); GC mode: gas chromatography-mass spectrometry. Shown here are representatives of three patterns we have identified.

