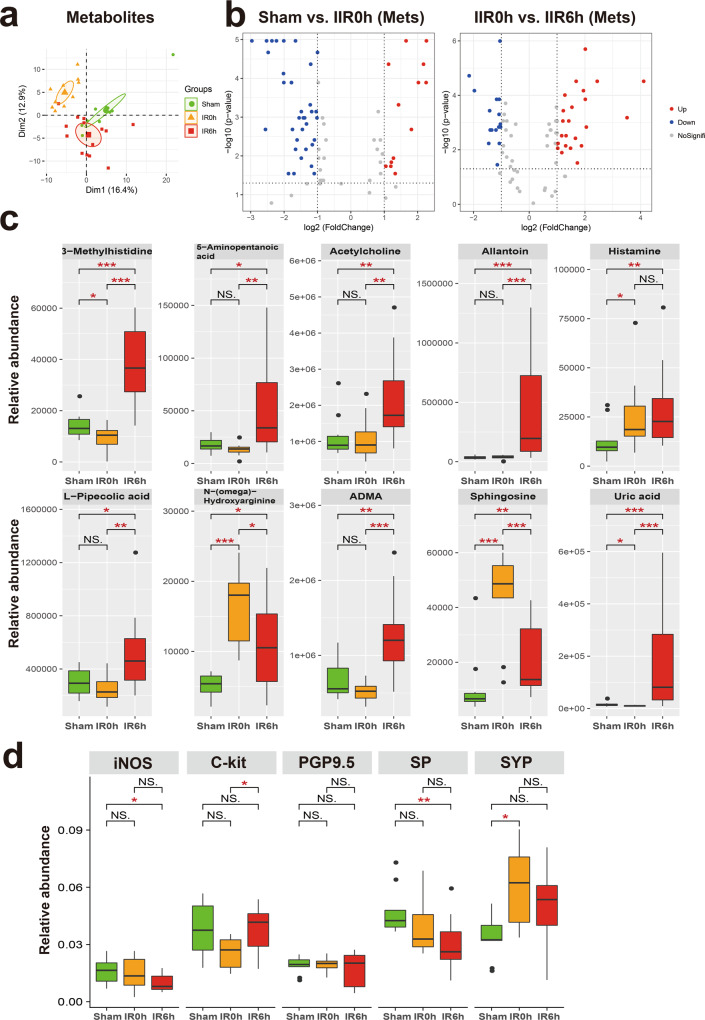
Fig. 4. Significantly altered metabolites and markers for neuroendocrine system in the gut during IIR.
a Principal component analysis (PCA) score plot derived from metabolites abundance. b The volcano plots displayed the statistical significance (P value) versus the magnitude of change (Log2 fold change). Features with Wilcoxon test p value <0.05 and absolute Log2 fold change (Log2FC) >1 were deemed to be significantly different. c Shown here are gut metabolites that were significantly altered during IIR and were not returned to normal levels at IIR6h, i.e., significantly different between IIR6h compared to Sham. Between-group comparisons were performed using the Wilcox test, n = 10 biologically independent animals in Sham group and n = 15 in IIR0h group, n = 10 in IIR6h group; *p < 0.05; **p < 0.01; ***p < 0.001; NS not significant. d Immunohistochemical level of several molecular markers for the intestinal neuroendocrine system significantly changed during IIR: nitric oxide synthase (iNOS), C-Kit, synaptophysin (SYP), protein gene product 9.5 (PGP9.5), and substance P (SP). Between-group comparisons were performed using the Wilcoxon test, n = 3 biologically independent animals; *p < 0.05; **p < 0.01; NS not significant. The box represents the median, 25th, and 75th percentiles and the error bars indicate the 5th and 95th percentiles.

