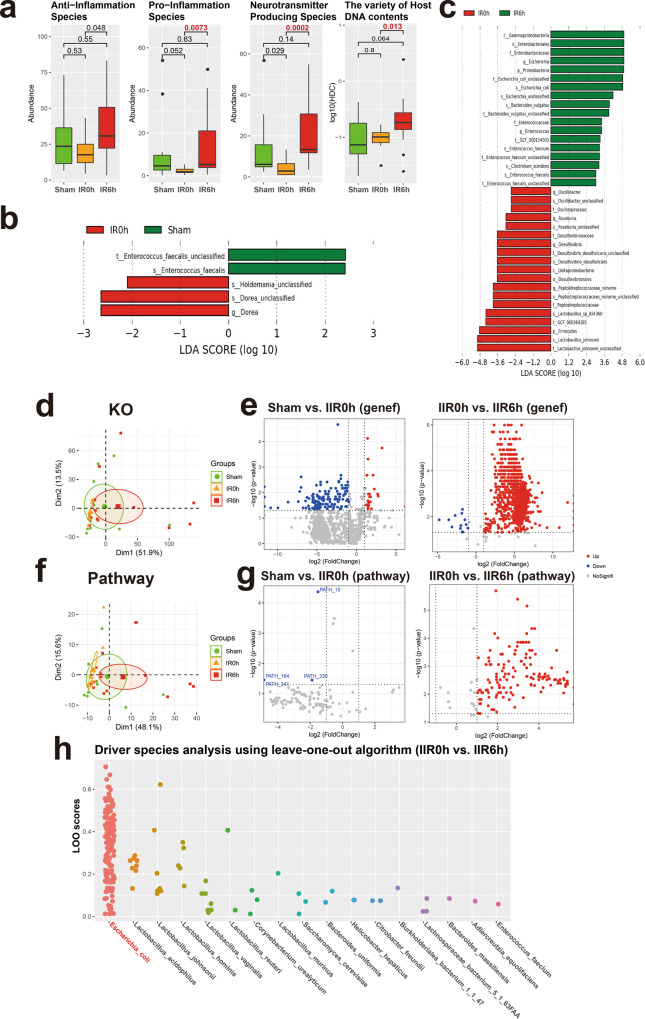
Fig. 5. Taxonomic and functional analysis of gut microbiome during IIR.
a Overall abundance changes for species with known functions and/or characteristics, including anti-inflammation, pro-inflammation, and neurotransmitter-producing capacity; the last panel shows the proportion of host DNA contents (HDC) that serves as a gut metagenomic marker for intestinal barrier integrity (See Methods for details). Between-group comparisons were performed using the Wilcox test, n = 10 biologically independent animals in the Sham group and n = 15 in the IIR0h group, n = 10 in the IIR6h group. The box represents the median, 25th, and 75th percentiles and the error bars indicate the 5th and 95th percentiles. b, c Differential species between time points as using LEfSe analysis. LDA score threshold of >2.0 and a 0.05 alpha value for the factorial Kruskal–Wallis test was applied to select different bacteria. d Functional analysis using KO. PCA analysis on KO profiles; each dot represents a sample (rat). e Volcano plots showing differential KO categories between IR0h as compared to Sham and IR6h as compared to IR0h. X-axis: P value (Wilcoxon rank-sum test), Y-axis: −Log2 fold change. Each dot represents a KO category; those with P values <0.05 and absolute Log2 fold change (Log2FC) >1 were highlighted and deemed to be significantly different. f, g Functional analysis using microbial pathways; similar to d, e. h Driver species analysis for the metabolic pathways using leave-one-out (LOO) algorithm. Each dot represents a pathway. X-axis: driver species, Y-axis: LOO score; the higher the score, the more important the species is for the pathway. Escherichia coli was identified as the strongest driver specie for most of the functional pathways during IIR.

