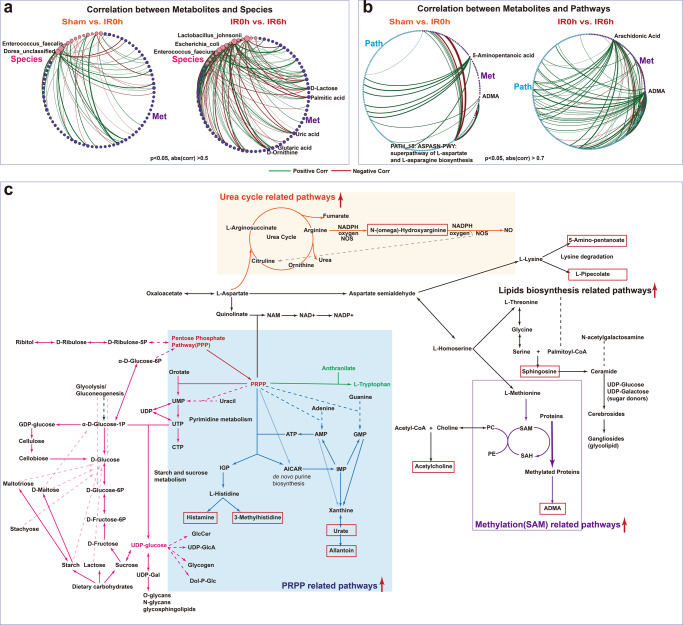
Fig. 6. Integrated microbiome-metabolome analysis identified key metabolic pathways and underlying key species.
a, b Significantly more connections (Spearman correlations) were identified between microbial metabolites and species abundance as well as gut pathways during the reperfusion period than that in the ischemia period. c A global map linking significantly altered metabolites and pathways and their putative underlying key species. Metabolites in the red boxes were those sharply increased at IR6h compared to Sham. Red arrows indicated that the associated pathways were significantly increased at IIR6h compared to Sham and IIR0h.

