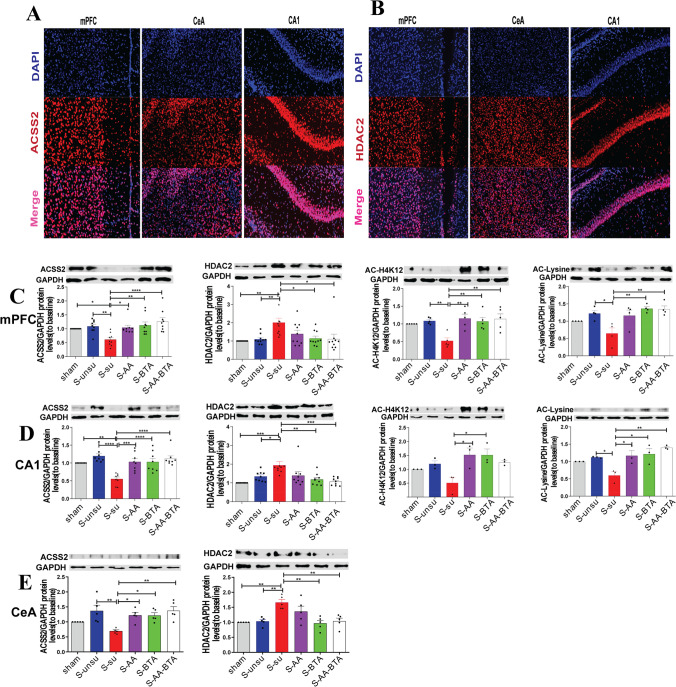
Fig. 6.
SCFA treatment regulated histone acetylation through the ACCS2-HDAC2 axis. A–B Representative immunofluorescent images of ACSS2 (red) and HDAC2 (red) in mPFC, CeA, and hippocampal CA1. Nuclei are stained blue. C Western blot analysis of ACSS2, HDAC2, ace-H4K12, and ace-lysine in mPFC in rats after SCFA treatment. D The expression level of ACSS2, HDAC2, ace-H4K12, and ace-lysine in hippocampal CA1 area after SCFAs treatment. E Representative western blots showing ACSS2 and HDAC2 expression in CeA area after SCFA treatment. Results are expressed as mean ± SEM; Tukey’s post hoc tests; *p < 0.05, **p < 0.01, ***p < 0.001, ****p < 0.0001

