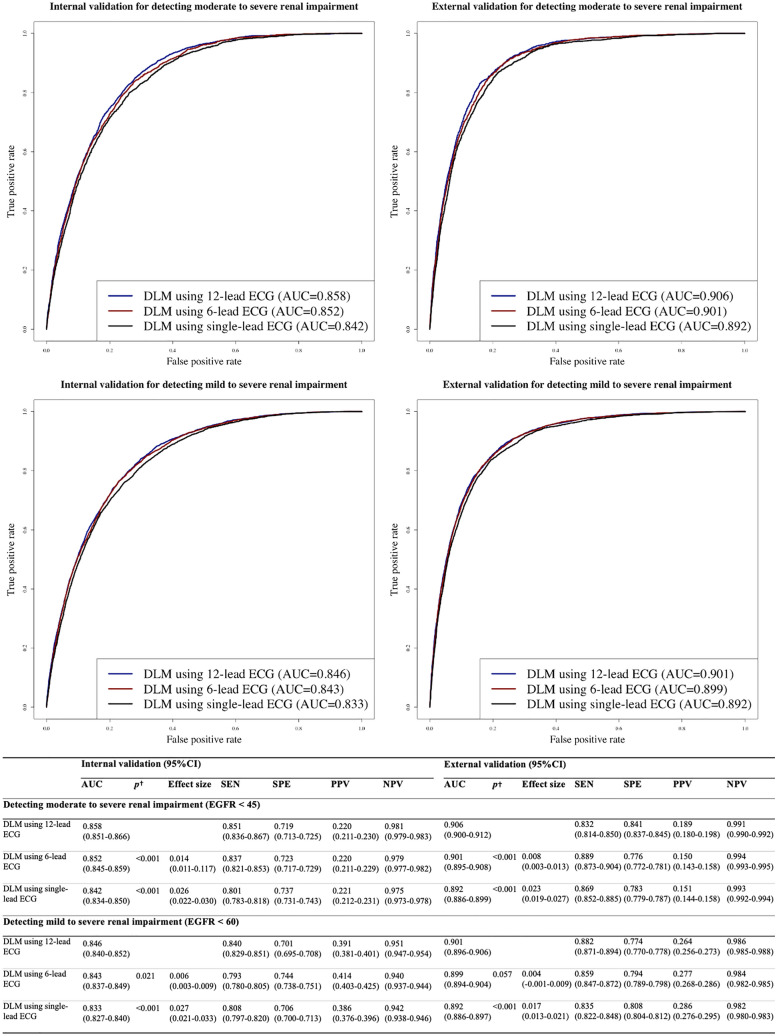
Fig. 2.
Performances of deep learning-based model for detecting renal impairment. Legend: †The alternative hypothesis for this p value was that there was a difference of AUC between the 12-lead ECG model and others. AUC denotes area under the receiver operating characteristic curve, ECG electrocardiography, EGFR estimated glomerular filtration rate, NPV negative predictive value, PPV positive predictive value, SEN sensitivity, and SPE specificity

