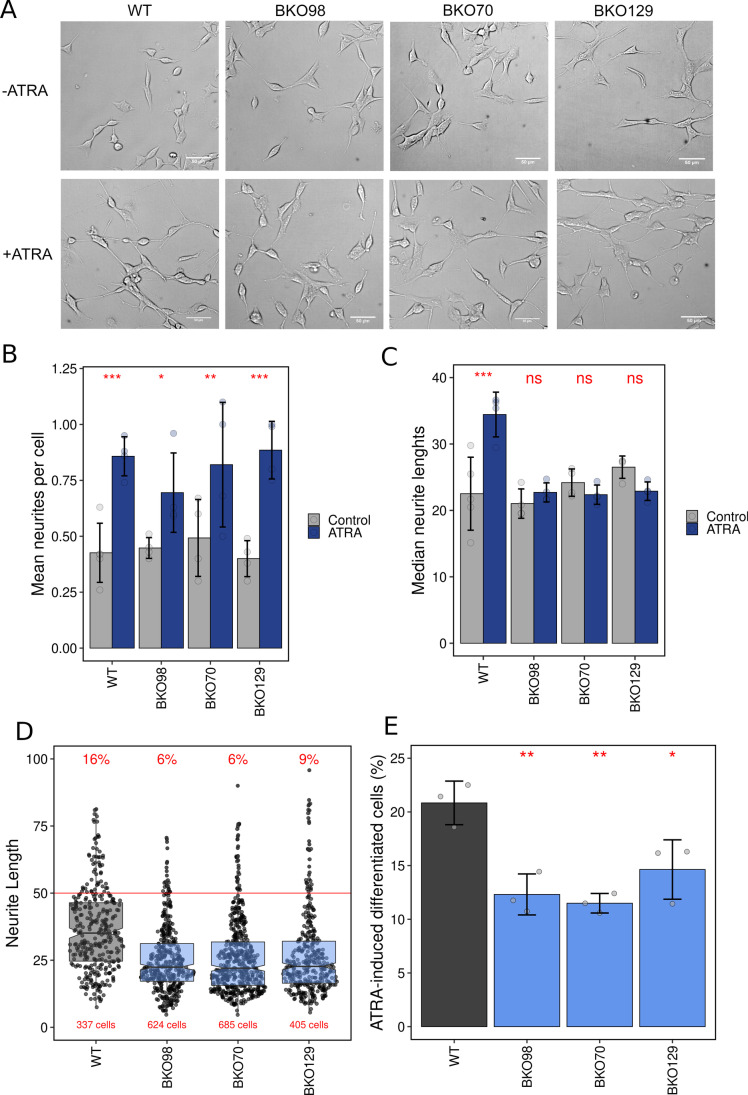
Fig. 2.
Morphological appearance and differentiation of wild-type and TOP2B null SH-SY5Y clones. (A) Phase-contrast images of WT and TOP2B null cell lines BKO98, BKO70, and BKO129 treated with either vehicle (EtOH, -ATRA) or 10 µM ATRA (+ ATRA) for 7 days. (B) Neurite outgrowths per cell were counted for control and ATRA-treated cells. The mean number of neurites counted per cell are plotted. (C) Neurite lengths were measured, and the median length calculated for each replicate. Means of medians are plotted. (D) Lengths of neurite outgrowths in ATRA-treated cells (data from all replicates combined) are plotted as a scattergram. The percentage of neurites that were longer than 50 µm and the total number of cells is indicated in red. (E) The percentage of cells exhibiting one or more neurites longer than 50 µm under control or ATRA-treated conditions was determined. The mean difference between control and ATRA-treated cells is plotted. Error bars represent 1 standard deviation. For (B), (C), and (E), the small circles represent the values from individual replicates. For (B) and (C), significance testing was performed by 2-way ANOVA with Bonferroni’s post-hoc test, and for (E), significance was tested using 1-way ANOVA with Dunnett’s post-hoc test (*P ≤ 0.05, **P ≤ 0.01, ***P ≤ 0.001)

