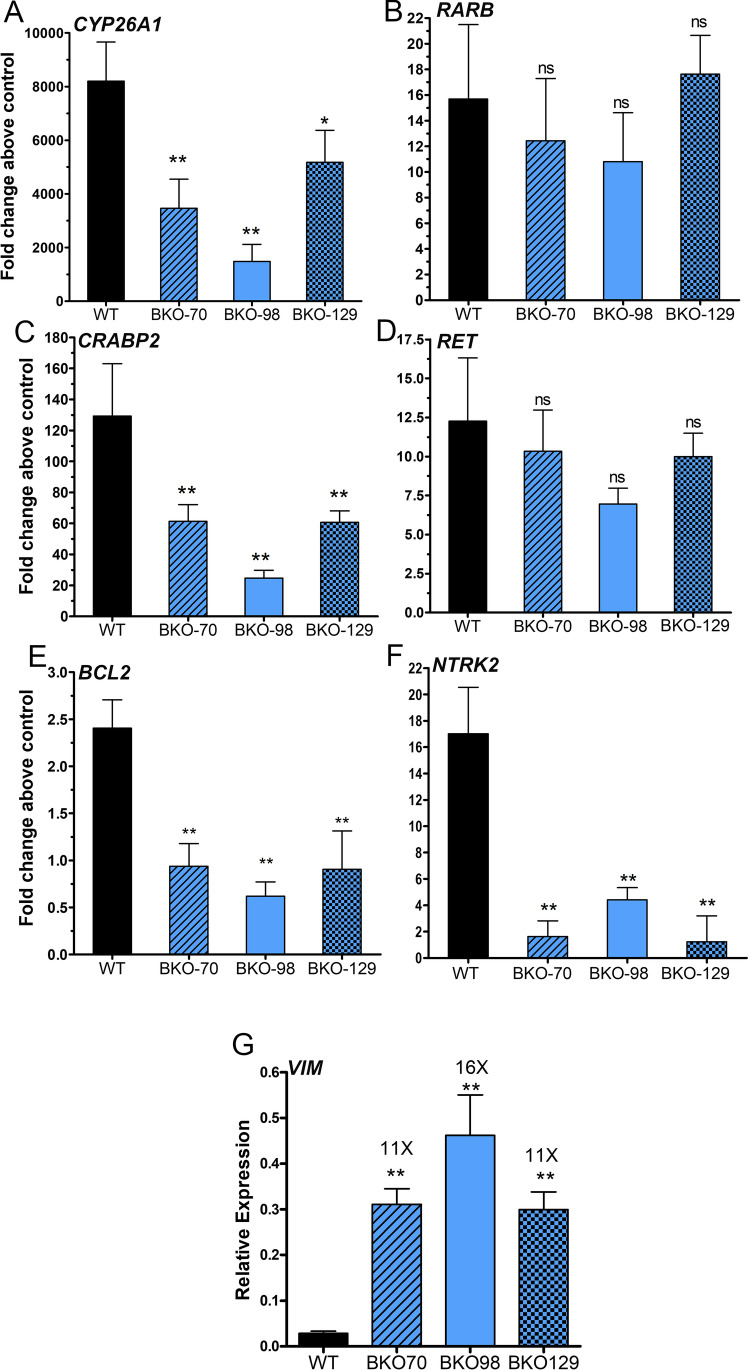
Fig. 3.
ATRA-induced gene expression in WT SH-SY5Y cells and TOP2B null clones. (A–F) Relative expression was determined by RT-qPCR using PP1A gene as a normalisation reference. Cells were treated with or without 1 μM ATRA, and the ΔΔCt method was used to calculate the fold change in induction above control for each clone. Data presented here is the mean of at least three independent experiments ± SD. (G) Relative expression in vimentin (VIM) in WT SH-SY5Y and TOP2B null clones. Significance tests were performed using 1-way ANOVA with Dunnett’s post-hoc test

