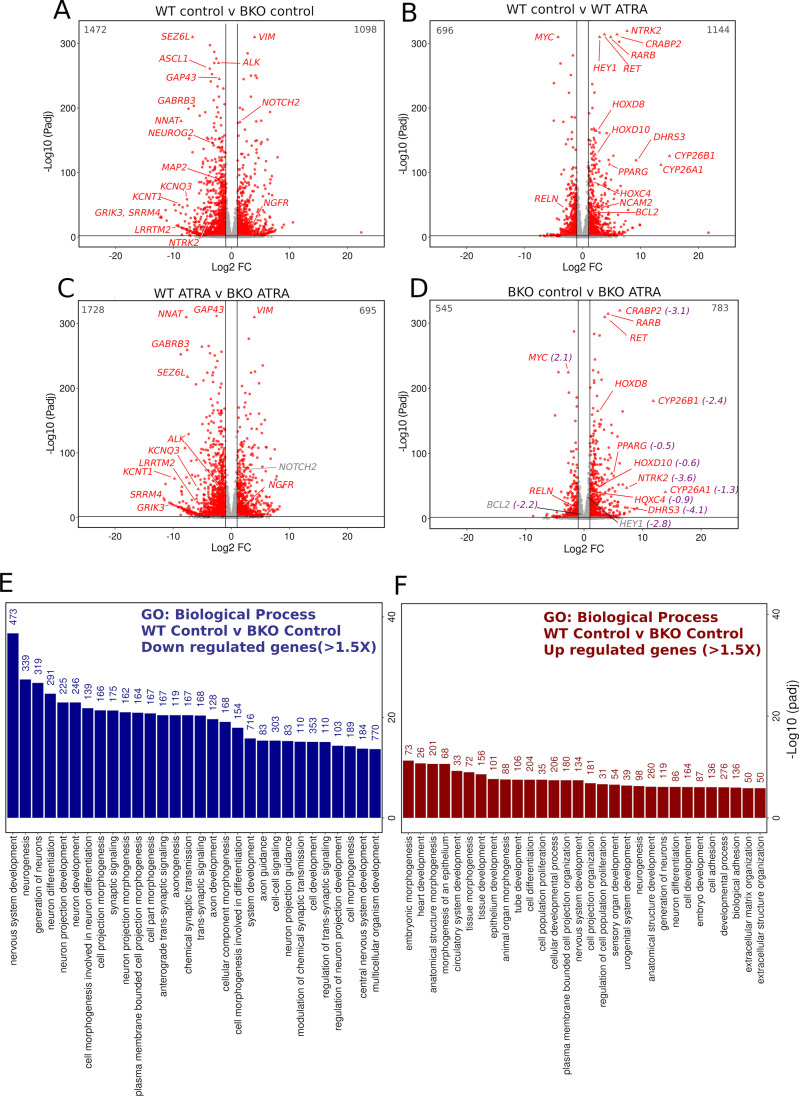
Fig. 4.
Differentially expressed genes: WT versus TOP2B null SH-SY5Y cells under control and ATRA-treated conditions. (A–D) Volcano plots showing differential gene expression in 4 different comparisons in SH-SY5Y cells or the TOP2B null clone BKO98. (A) WT cells versus BKO98 cells, vehicle control. (B) WT cells, vehicle control versus WT cells ATRA treatment. (C). WT cells versus BKO98 cells after ATRA treatment. (D) BKO98 cells, vehicle control versus BKO98 cells ATRA treatment. Transcripts that were significantly (Padj < 0.05) either up- or downregulated by more than 1 log2 fold are labelled red. Specific genes mentioned in the text are labelled. In (D) Log2FC (WT control versus BKO control) values are included in purple if the respective genes were over- or under-expressed in untreated BKO cells by more than 1.5 × . (E and F) Biological process terms associated with genes down- (E) or (F) upregulated > 1.5 × in TOP2B null (BKO98) versus WT SH-SY5Y cells. Analysis was performed using g:GOSt (https://biit.cs.ut.ee/gprofiler/gost), non-ordered, significance threshold Benjamini–Hochberg FDR < 0.05) [67]. Only the top 30 terms by significance value are shown. Intersect size is shown above each bar

