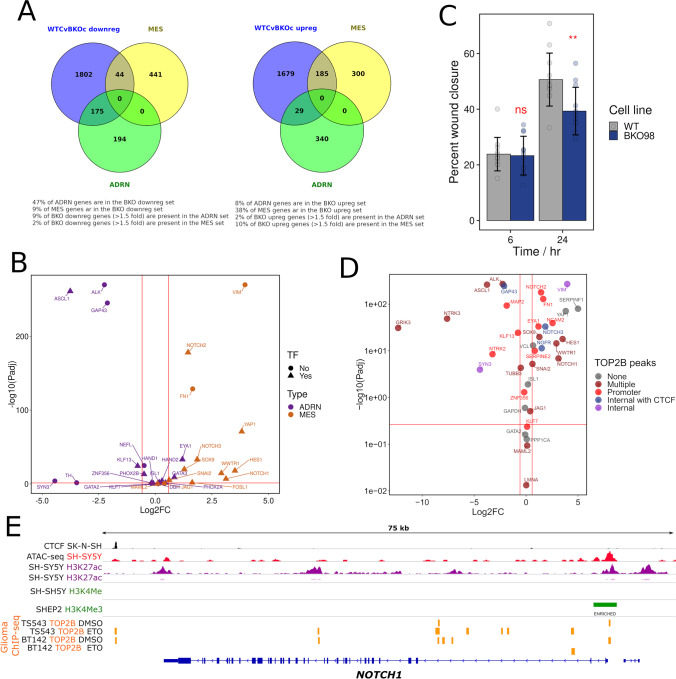
Fig. 5.
The profile of up- and downregulated genes in BKO98 cells suggests a transition towards a more undifferentiated mesenchymal state in TOP2B null cells. (A) Intersections between genes downregulated (left) or upregulated (right) in BKO98 cells (greater than 1.5-fold, Padj < 0.05) and genes characteristic of committed adrenergic neurone-like (ADRN) or undifferentiated mesenchymal cell-like (MES) neuroblastoma cells [42]. Intersections are plotted as Venn diagrams. (B) Volcano plot of WT SH-SY5Y versus BKO98 Log2 fold change values, showing key genes that characterise the ADRN (purple) or MES (orange) states. (C) Cell migration of WT and BKO98 cells was compared using a wound healing assay. Nearly confluent monolayers of cells were scratched with a pipette tip and percentage “would closure” was measured from phase-contrast images after 6 or 24 h in starvation medium. Data are mean values + / − standard deviation. (D) Plot illustrating the relationship between the presence of TOP2B binding peaks and gene expression changes between WT and BKO cells. Genes are categorised according to the evidence for TOP2B binding from inspection of a published glioma ChIP-seq data set [62] according to the following scheme: none, no peaks observed in the promoter region or gene body; multiple, multiple peaks present; promoter, peak or peaks present in the promoter region; internal with CTCF, TOP2B peak or peaks at a gene-internal position coincident with CTCF binding; and internal, peak or peaks within the gene, not associated with CTCF. (E) Profile of epigenetic features, including glioma TOP2B binding activity [62] for NOTCH1, profiles for other relevant genes are shown in Fig. S8. Data were plotted using the Integrated Genome Viewer (IGV, Broad Institute) [75] using the following data sources (GEO accession and citation): SK-N-SH CTCF ChIP-seq, GSM2038347; SH-SY5Y ATAC-seq, GSM2700775 [76]; SH-SY5Y H3K27ac, GSM3676080 [77]; GSM2038349; SH-SY5Y H3K4Me3, GSM2419933 [41, 42]; SH-EP H3K4Me3, GSM2419932 [41, 42]; and TOP2B ChIP-seq data from TS543 and BT142 glioma cell lines in the absence (DMSO) or presence of etoposide (ETO), GSM3904399, GSM3904400, GSM3904401, and GSM3904402 [62]

