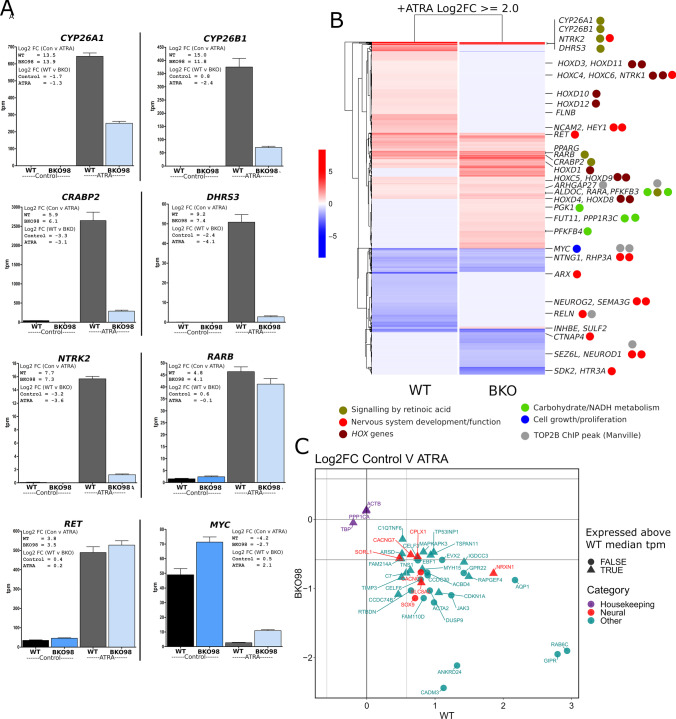
Fig. 6.
Differential expression of ATRA modulated genes in WT and TOP2B null (BKO98) SH-SY5Y cells lines. RNA-seq expression data is plotted to show relative expression levels (tpm, transcripts per kilobase million) for each gene in the four conditions, WT and BKO98, control, or ATRA treated. Log2 fold change (Log2FC) values are shown in insets. (B) Heatmap contrasting the transcriptional response to ATRA of WT SH-SY5Y and BKO98 cells. Significant genes are named and colour coded according to functional class (TOP2B ChIP-seq data from [68]). (C) Log2FC plot for genes whose expression is induced by ATRA in WT cells but reduced by ATRA in BKO98 cells highlighting in red genes that contribute to neural development or function Biological Process terms. For comparison, three housekeeping genes are also included. Genes are also classified according to their relative expression in WT untreated cells (above or below median tpm value)

