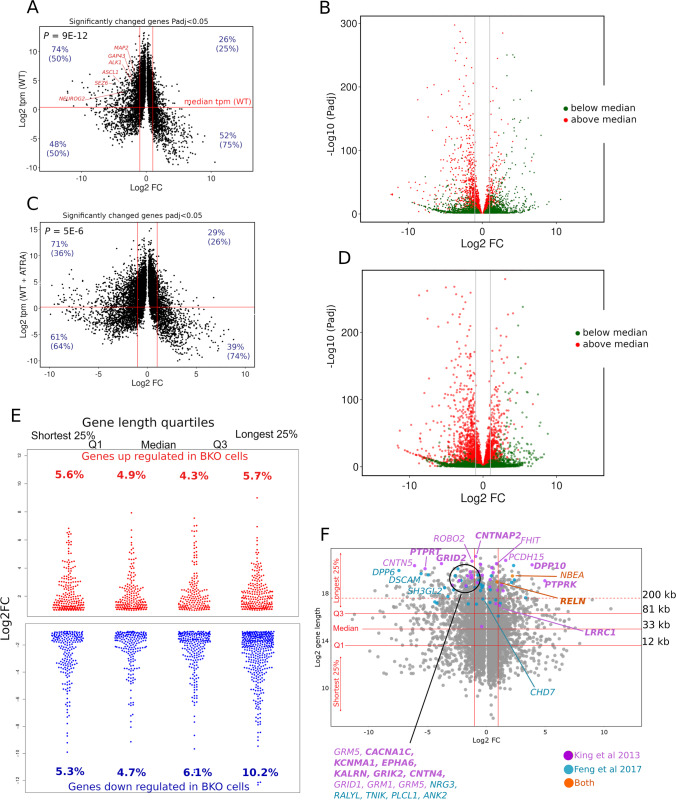
Fig. 8.
Genes downregulated in BKO98 cells are enriched for genes that are expressed at a high level in WT SH-SY5Y cells and long genes. (A) Volcano plot of genes differentially expressed (Padj < 0.05) between WT SH-SY5Y and BKO98 cells. Log2FC (x axis) is plotted against Log2 tpm (transcripts per million kilobases, y axis). The median tpm calculated for WT SH-SY5Y is indicated as a horizontal line. Vertical red lines indicate a Log2FC of + / − 1.0. (B) Volcano plot (Log10FC against -Log10 Padj) indicating genes expressed above (red) or below (green) the median tpm level in WT SH-SY5Y cells. (C and D) plots equivalent to (A and B), but data points are from ATRA-treated WT SH-SY5Y or BKO98 cells. P values shown for (A) and (C) are Mann–Whitney test values demonstrating significantly different Log2FC values for genes expressed at above versus below the median tmp value. For (A) and (C), figures in blue (non-bracketed) refer to the percentage of genes expressed at above or below the median tmp value that are either under or overexpressed in BKO cells. Figures in brackets are the percentages of either under or overexpressed genes that are expressed at above or below the median tmp value in wild-type cells. (E) Distribution and proportion of up- and downregulated protein-coding genes (Log2FC > 1.0 or < − 1.0, Padj < 0.05) in each gene length quartile category. Numbers correspond to percentage of these genes out of all protein-coding genes expressed in the data set in each gene length category. (F) Plot for protein-coding genes differentially expressed between WT SH-SY5Y and BKO98 cells (Padj < 0.05) by gene length. Q1, median, and Q3 lengths are indicated by solid horizontal red lines; the dashed red line highlights a gene length of 200 kb. Genes identified by King et al. [17] as long genes affected by depletion of topoisomerase activity, and which are candidate genes for autistic spectrum disorder (ASD), are highlighted in green, and genes identified by Feng et al. [16] as downregulated in mouse CGNs upon treatment with ICRF-193 are shown in blue. Those appearing in both lists are highlighted in red. where those genes were shown to be associated with a ChIP-seq TOP2B peak [68] the names are shown in bold

