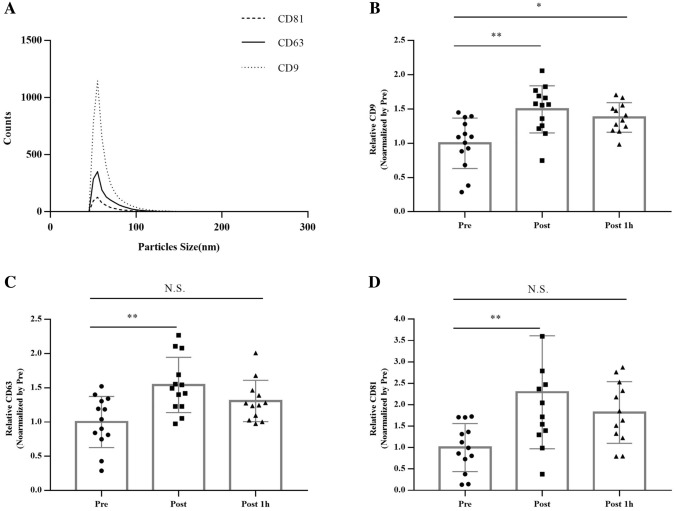
Fig. 3.
Characteristics of urinary EV marker proteins after the 20 m SRT. a The size distribution of all samples. (b–d) Relative concentrations of exosome marker proteins. Statistical analysis was performed with the aid of the ordinary one-way ANOVA with Tukey’s multiple comparisons test due to a missing sample (one participant could not collect the urine sample). The data represent means ± SEM. *p < 0.05, **p < 0.01, N.S. not significant

