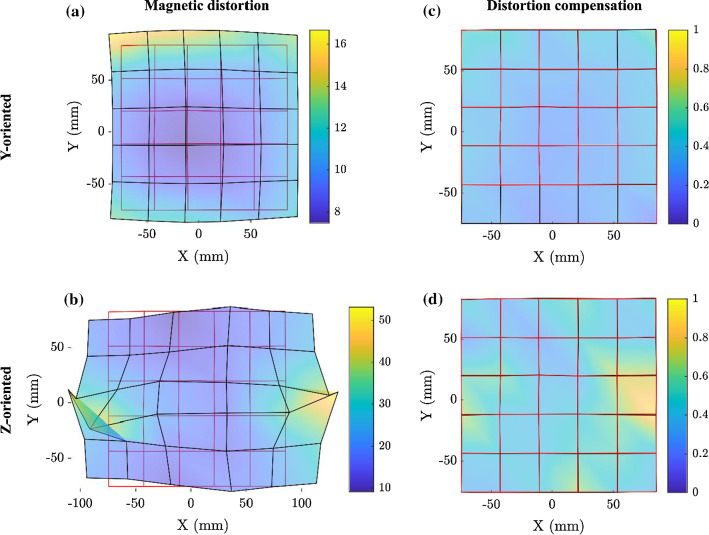
Fig. 2.
a, b EMT solution in the presence of the fluoroscopy system and c, d accuracy improvement obtained after calibration and correction, for a magnetic sensor oriented like a, c Y and b, d Z axis, respectively. The red grid is formed by joining the test points’ physical positions, the black grid represents the tracked points. The colour map (mm) also accounts for the error in the Z direction, which is not appreciable from the 2D plots

