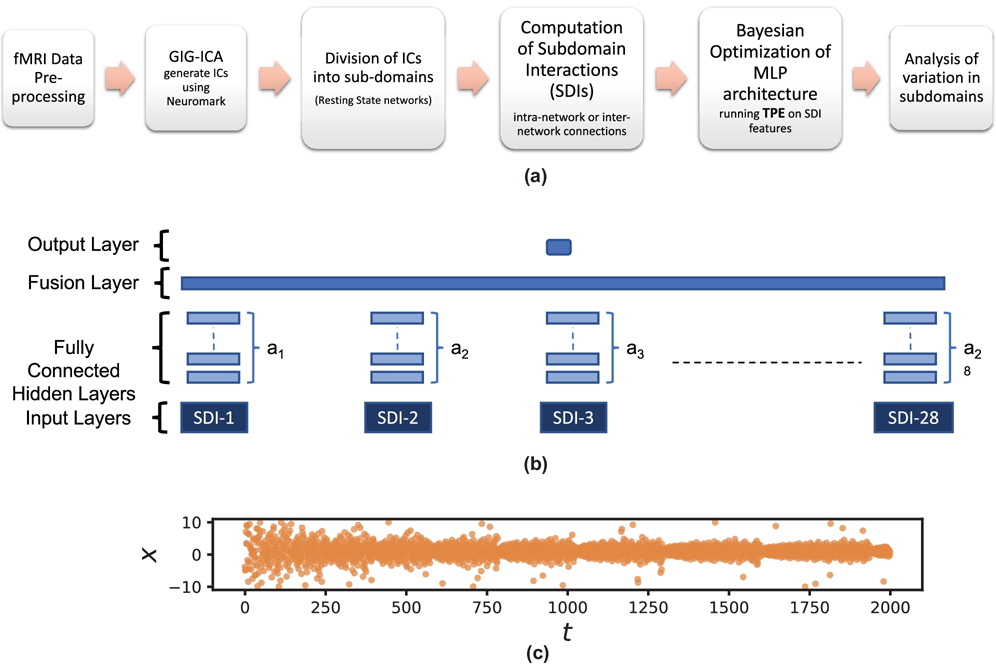
Figure 1.
(a) A step-by-step description of the whole analysis. (b) An architecture in the search space that TPE optimizes over, defined by the vector , with xi ∈ {0, 1, 2} representing the number of fully connected hidden layers on top of the input node corresponding to data from the i-th subdomain interaction (SDI). Data for each SDI is a sub-matrix of the full static functional connectivity matrix with connections from participating subdomain(s). (c) TPE search space traversal on a toy example with a quadratic cost function (x − 1)2 to narrow down the search closer to the optimal value.

