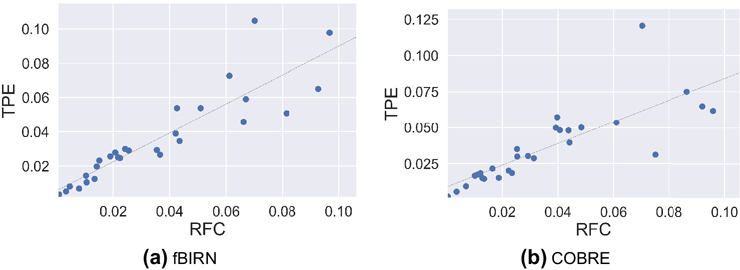
Figure 7.
To check whether the relative importance of SDI parameters learned in the fusion layer of MLP architecture is similar to the functional connectivity features of the corresponding SDI, Random Forest classifier was used to compute purity-based feature importance on the parameters in the fusion layer as well as the input layer (connectivity features). The prediction power vector obtained for both these cases was divided into 28 bins corresponding to each SDI and summed to get the cumulative prediction power of each of the SDIs. The above plots show the cumulative prediction power of SDIs, averaged over 50 repetitions, in the learned parameters inside the fusion layer (marked as TPE on the y-axis) and in the functional connectivity features in the input layer (marked as RFC on the x-axis). There was a high correlation of 0.9 and 0.81 between these prediction power values for (a) fBIRN and (b) COBRE datasets respectively. This means that in addition to being consistent in terms of the prediction accuracy, the TPE algorithm is also consistent in terms of the importance that the SDIs have for the prediction task.

