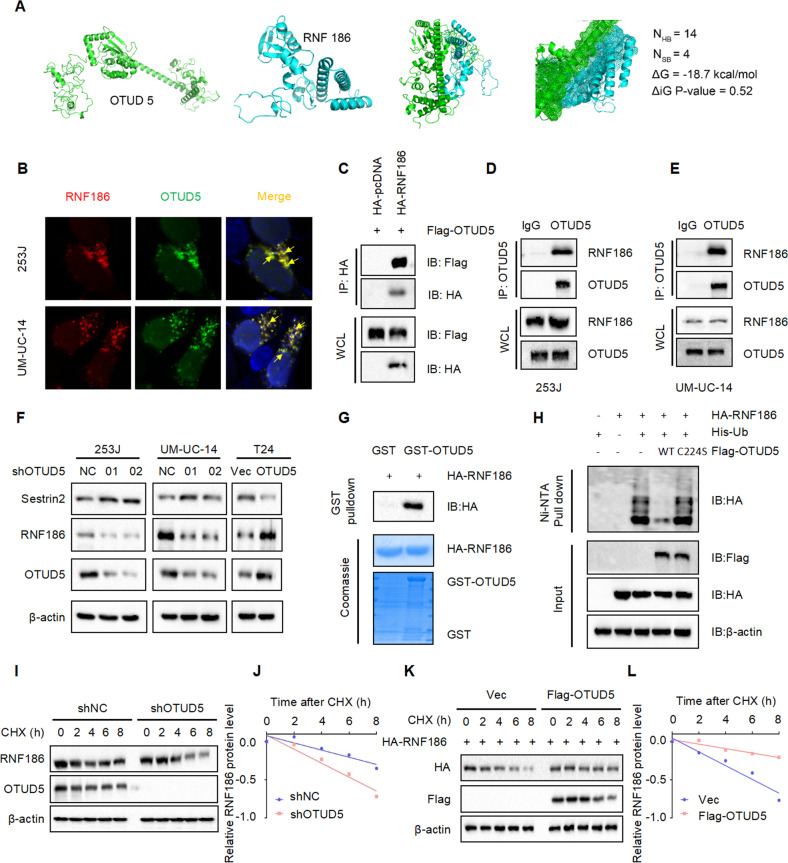
Fig. 5. OTUD5 stabilizes RNF186 by deubiquitination, leading to sestrin2 degradation.
A Protein binding prediction chart for OTUD5 and RNF186. B Confocal immunofluorescence microscopic analysis of OTUD5 and RNF186 in 253 J and UM-UC-14 cells. Scale bars represent 10 μm. C IB analysis of WCL and anti-HA immunoprecipitates (IPs) derived from 293 T cells transfected with Flag-OTUD5 and HA-tagged RNF186, pcDNA3.1 was used as the control. D, E OTUD5 interacts with RNF186. Co-immunoprecipitation (co-IP) of OTUD5 and RNF186 was assayed in 253 J and UM-UC-14 cells. Immunoprecipitation (IP) was performed using the antibody against OTUD5, and the endogenous interaction between OTUD5 and RNF186 was determined by Western blotting using the antibody against RNF186. F IB analysis of WCL derived from 253 J and UM-UC-14 cells stably expressing shOTUD5 and T24 cells stably overexpressing OTUD5. RNF186 and sestrin2 were detected, β-actin was used as the loading control. G GST pull-down assay revealed the direct interaction between RNF186 and OTUD5. The upper panel presents the result of IB using the antibody against HA, and the lower panels show Coomassie blue staining of the purified proteins. H IB analysis of WCL and Ni-NTA pull-down products derived from 293 T cells transfected with Flag-OTUD5 WT, Flag-OTUD5 C224S, HA-RNF186 and His-Ub. 20 μM MG132 was added 6 h before harvesting the cells. I OTUD5 knockdown cells (shOTUD5) as well as parental UM-UC-14 cells (shNC) were treated with 100 μg/ml cycloheximide (CHX) for the indicated time period before harvesting. Equal amounts of WCL were immunoblotted with the indicated antibodies. J Quantification of the band intensities in (I). RNF186 levels were normalized to the corresponding β-actin levels, then normalized to the t = 0 h RNF186 level. K IB analysis of WCL derived from 293 T cells transfected with HA-RNF186, Flag-EV and Flag-OTUD5. Cells were treated with 100 μg/ml CHX for the indicated time period before harvesting. EV empty vector. L Quantification of the band intensities in K. RNF186 levels were normalized to the corresponding β-actin levels, then normalized to the t = 0 h RNF186 level. All data are presented as mean ± SD of 3 independent experiments.

