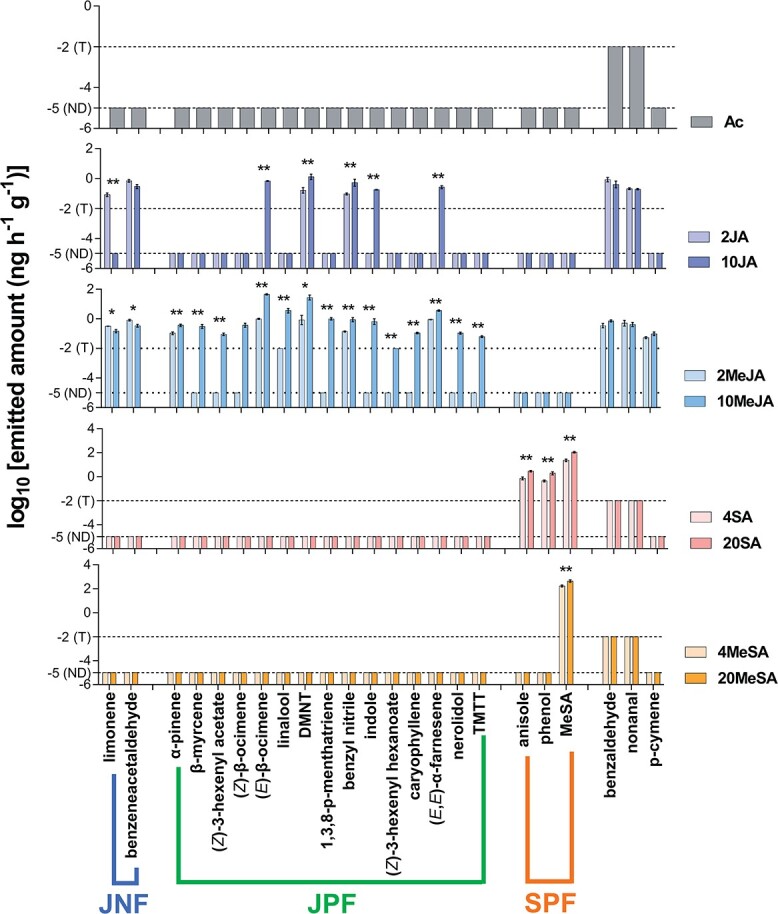
Figure 2.

Feature definitions for JA and SA pathways in the theoretical model. Bar values represent the log-transformed amounts of emitted compounds (data are presented as mean ± standard error, n = 4). ND, not detected; T, <0.01 ng h−1 g−1 (signal-to-noise ratio = 3). Asterisks indicate significant differences in the emitted amount between two concentrations of the same elicitor (independent samples t-test; *P < .05; **P < .01). DMNT, (E)-4,8-dimethyl-1,3,7-nonatriene; TMTT, (E,E)-4,8,12-trimethyl-1,3,7,11-tridecatetraene; Ac, 2% acetone; 2JA, 2 mM JA; 10JA, 10 mM JA; 2MeJA, 2 mM MeJA; 10MeJA, 10 mM MeJA; 4SA, 4 mM SA; 20SA, 20 mM SA; 4MeSA, 4 mM MeSA; 10MeSA, 10 mM MeSA.
