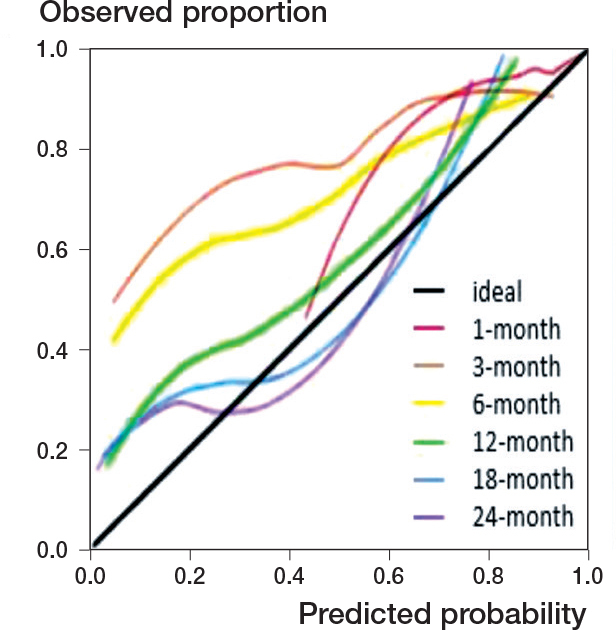
Figure 3.

Calibration plots of predictions by PATHFx are shown for 1-month, 3-month, 6-month, 12-month, 18-month, and 24-month survival. The calibration plot visualizes how accurate the predictions are over different probabilities. The diagonal line represents the optimal calibration; the closer the line of the model, the more accurate the prediction. The calibration intercepts were 1.00 (CI 0.50–1.51) for 1-month, 1.60 (CI 1.31–1.90) for 3-month, 1.39 (CI 1.13–1.64) for 6-month, 0.61 (CI 0.36–0.85) for 12-month, 0.42 (CI 0.16–0.68) for 18-month, and 0.52 (CI 0.24–0.80) for 24-month survival prediction. The calibration slopes were 0.75 (CI 0.28–1.21) for 1-month, 0.51 (CI 0.25–0.76) for 3-month, 0.52 (CI 0.29–0.75) for 6-month, 0.71 (CI 0.48–0.94) for 12-month, 0.59 (CI 0.38–0.79) for 18-month, and 0.51 (CI 0.31–0.71) for 24-month survival prediction.
