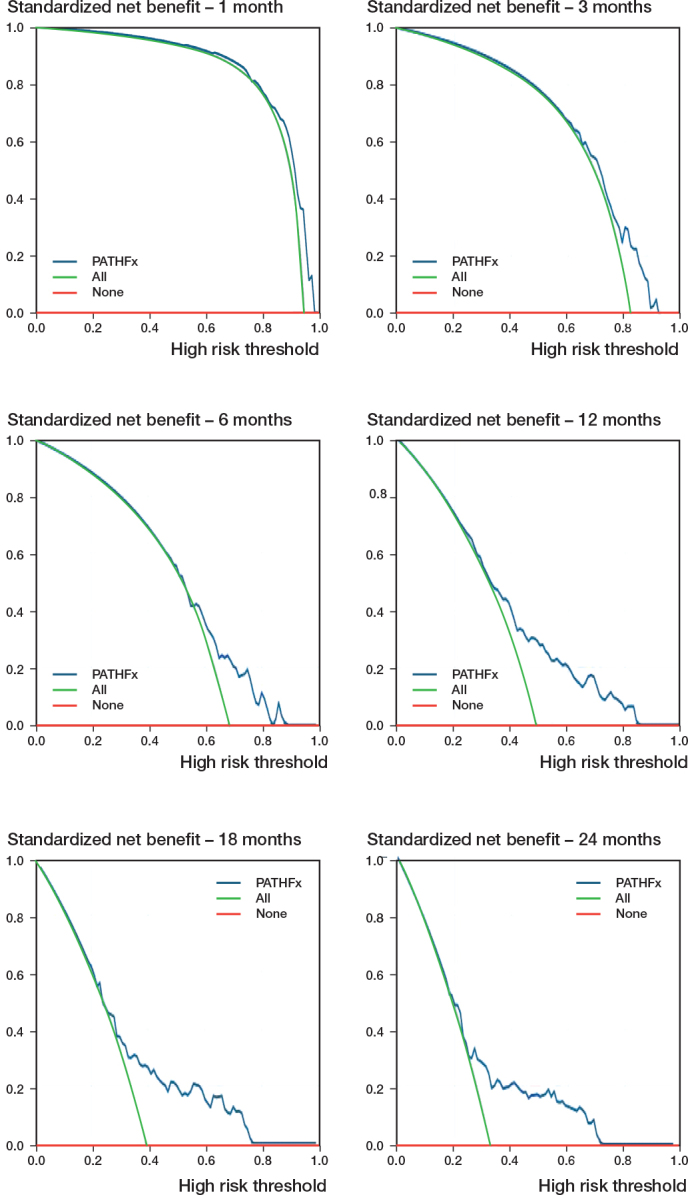
Figure 5.

Decision-curve analysis plots of predictions by PATHFx are shown for 1-month, 3-month, 6-month, 12-month, 18-month, and 24-month survival. The range of threshold probabilities are 0.9~1.0 (1-month), 0.7~0.9 (3-month), 0.5~0.9 (6-month), 0.3~0.8 (12-month), 0.3~0.8 (18-month), and 0.2~0.7 (24-month), respectively.
