
Fig. 7.
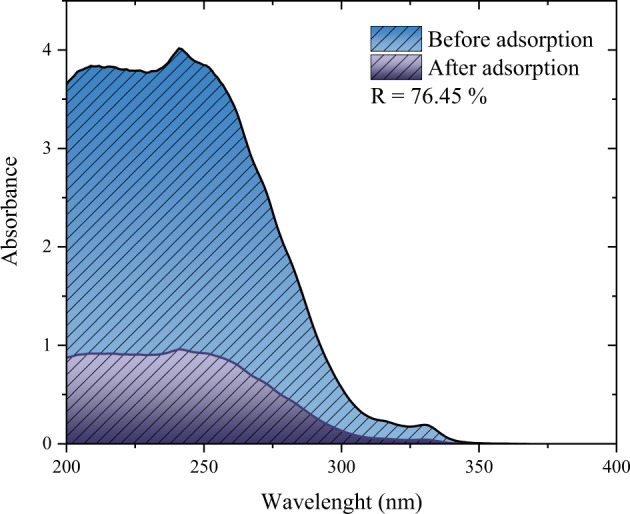
Spectra for the simulated effluent before and after the adsorption treatment (T = 298 K, adsorbent dosage = 2 g L−1, pH = 6.5, stirring rate = 180 rpm, V = 100 mL)
Official websites use .gov
A
.gov website belongs to an official
government organization in the United States.
Secure .gov websites use HTTPS
A lock (
) or https:// means you've safely
connected to the .gov website. Share sensitive
information only on official, secure websites.
Spectra for the simulated effluent before and after the adsorption treatment (T = 298 K, adsorbent dosage = 2 g L−1, pH = 6.5, stirring rate = 180 rpm, V = 100 mL)