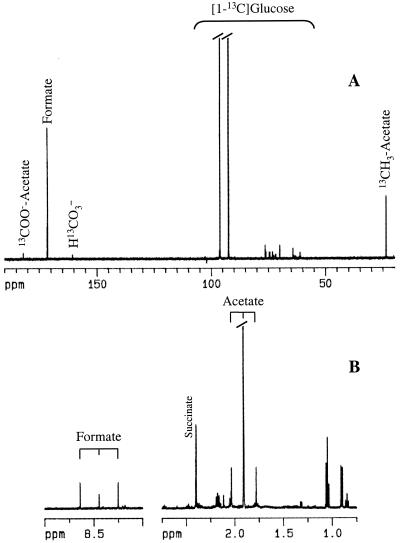
FIG. 1.
NMR spectra of the supernatant containing the end products derived from the fermentation of [1-13C]glucose by T. zilligii. The cell suspension (4.5 ml and 7-mg/ml protein concentration) was incubated with 15 mM [1-13C]glucose for 2 h at 75°C. (A) 13C NMR spectrum acquired on a Bruker DRX500 spectrometer using a 5-mm selective probe head (spectral width, 31 kHz; data size, 64,000; repetition delay, 61 s; pulse width, 7 μs). Proton decoupling was applied during the acquisition time (1 s). (B) 1H NMR spectrum acquired on the same spectrometer with water presaturation (spectral width, 5 kHz; data size, 64,000; repetition delay, 17 s; pulse width, 7 μs). In the 13C NMR spectrum, resonances arising from nonmetabolized [1-13C]glucose are apparent in the region between 60 and 100 ppm. In the representation of the 1H NMR spectrum, the strong intensity resonance due to the unlabeled methyl group of acetate has been truncated.

