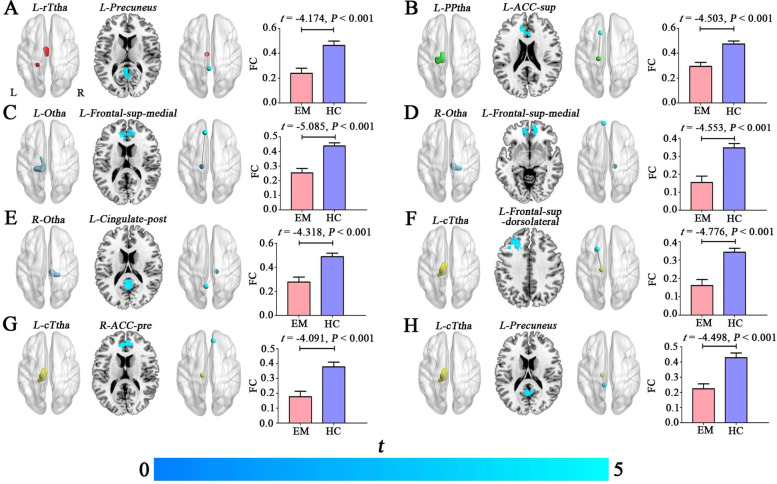
Fig. 3.
Decreased rsFC of the thalamic subregions in patients with episodic migraine (A-H). The seed regions (L-rTtha, L-PPtha, L(R)-Otha, L-cTtha) for the voxel-based rsFC are illustrated in the first column. Brain regions (L-ACC-sup, L-Frontal-sup-medial, L-Cingulate-post, L-Frontal-sup, R-ACC-pre, L-Precuneus) showing decreased rsFC with the seed regions in patients with EM compared with HCs are shown in the second column. The functional connectivity (brown lines) between L-rTtha (red sphere) and L-precuneus (light blue sphere), between L-PPtha (light blue sphere) and L-ACC-sup (light blue sphere), between L-Otha (peacock blue sphere) and L-frontal-sup-medial (light blue sphere), between R-Otha (peacock blue sphere) and L-frontal-sup-medial (light blue sphere), between R-Otha (peacock blue sphere) and L-Cingulate-post (light blue sphere), between L-cTtha (yellow sphere) and L-frontal-sup (light blue sphere), between L-cTtha (yelllow sphere) and R-ACC-pre (light blue sphere), and between L-cTtha (yelllow sphere) and L-precuneus (light blue sphere) are shown in the third column. The fourth column represents the ROI-based rsFC analysis for the significant clusters. The error bars indicate the standard error of the mean. Abbreviations: EM, episodic migraine; HC, healthy control; FC, functional connectivity; L, left; R, right

