. 2022 Sep 3;36(5):2473–2480. doi: 10.21873/invivo.12983

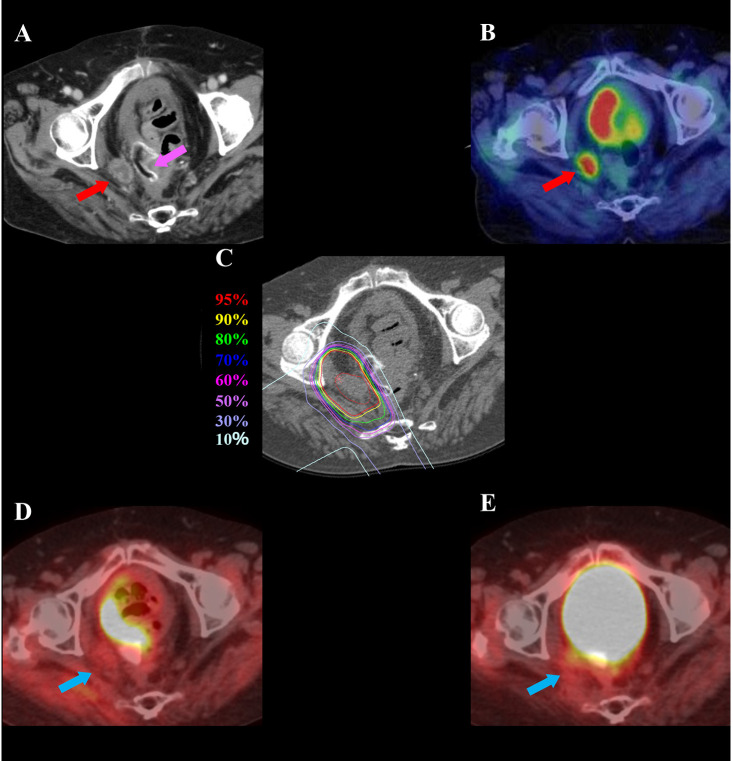
Figure 1. A 72-year-old female patient with pelvic recurrence of rectal cancer after preoperative chemoradiotherapy and rectal surgery treated with C-ion radiotherapy. A: Contrast-enhanced computed tomography image taken before treatment. The red arrow shows the tumor with contrast enhancement, and the magenta arrow shows the spacer. B: Fluorodeoxyglucose (FDG) positron-emission tomography (PET) taken before treatment. The red arrow shows the tumor with abnormal FDG uptake. C: Dose distribution on an axial computed tomography image. The area within the red outline is the gross tumor volume. Highlighted areas represent 95% (red), 90% (yellow), 80% (green), 70% (dark blue), 60% (magenta), 50% (purple), 30% (blue), and 10% (light blue) isodose curves; 100% was 73.6 Gy (relative biological effectiveness). D: FDG-PET taken 3 months after treatment. FDG uptake was reduced compared to before treatment (blue arrow). E: FDG-PET taken 21 months after treatment showing no FDG uptake (blue arrow). There was no evidence of local recurrence.

Figure 1