
Figure 3.
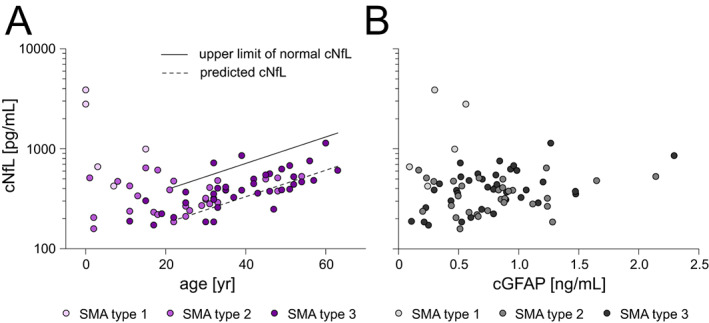
cNfL concentrations before treatment initiation. (A) Association between age and cNfL concentration before treatment initiation; each icon represents an individual person; shades of purple distinguish SMA type. Solid line indicates upper limit of normal (reported by Yilmaz et al.), dashed line shows predicted cNfL concentration (calculated using regression formula determined by Yilmaz et al.). (B) Correlation between cGFAP and cNfL concentration before treatment initiation; each icon represents an individual person; shades of gray distinguish SMA type. cNfL, neurofilament light chain concentration in cerebrospinal fluid; cGFAP, glial fibrillary acidic protein concentration in cerebrospinal fluid; N = 73. [Colour figure can be viewed at wileyonlinelibrary.com]