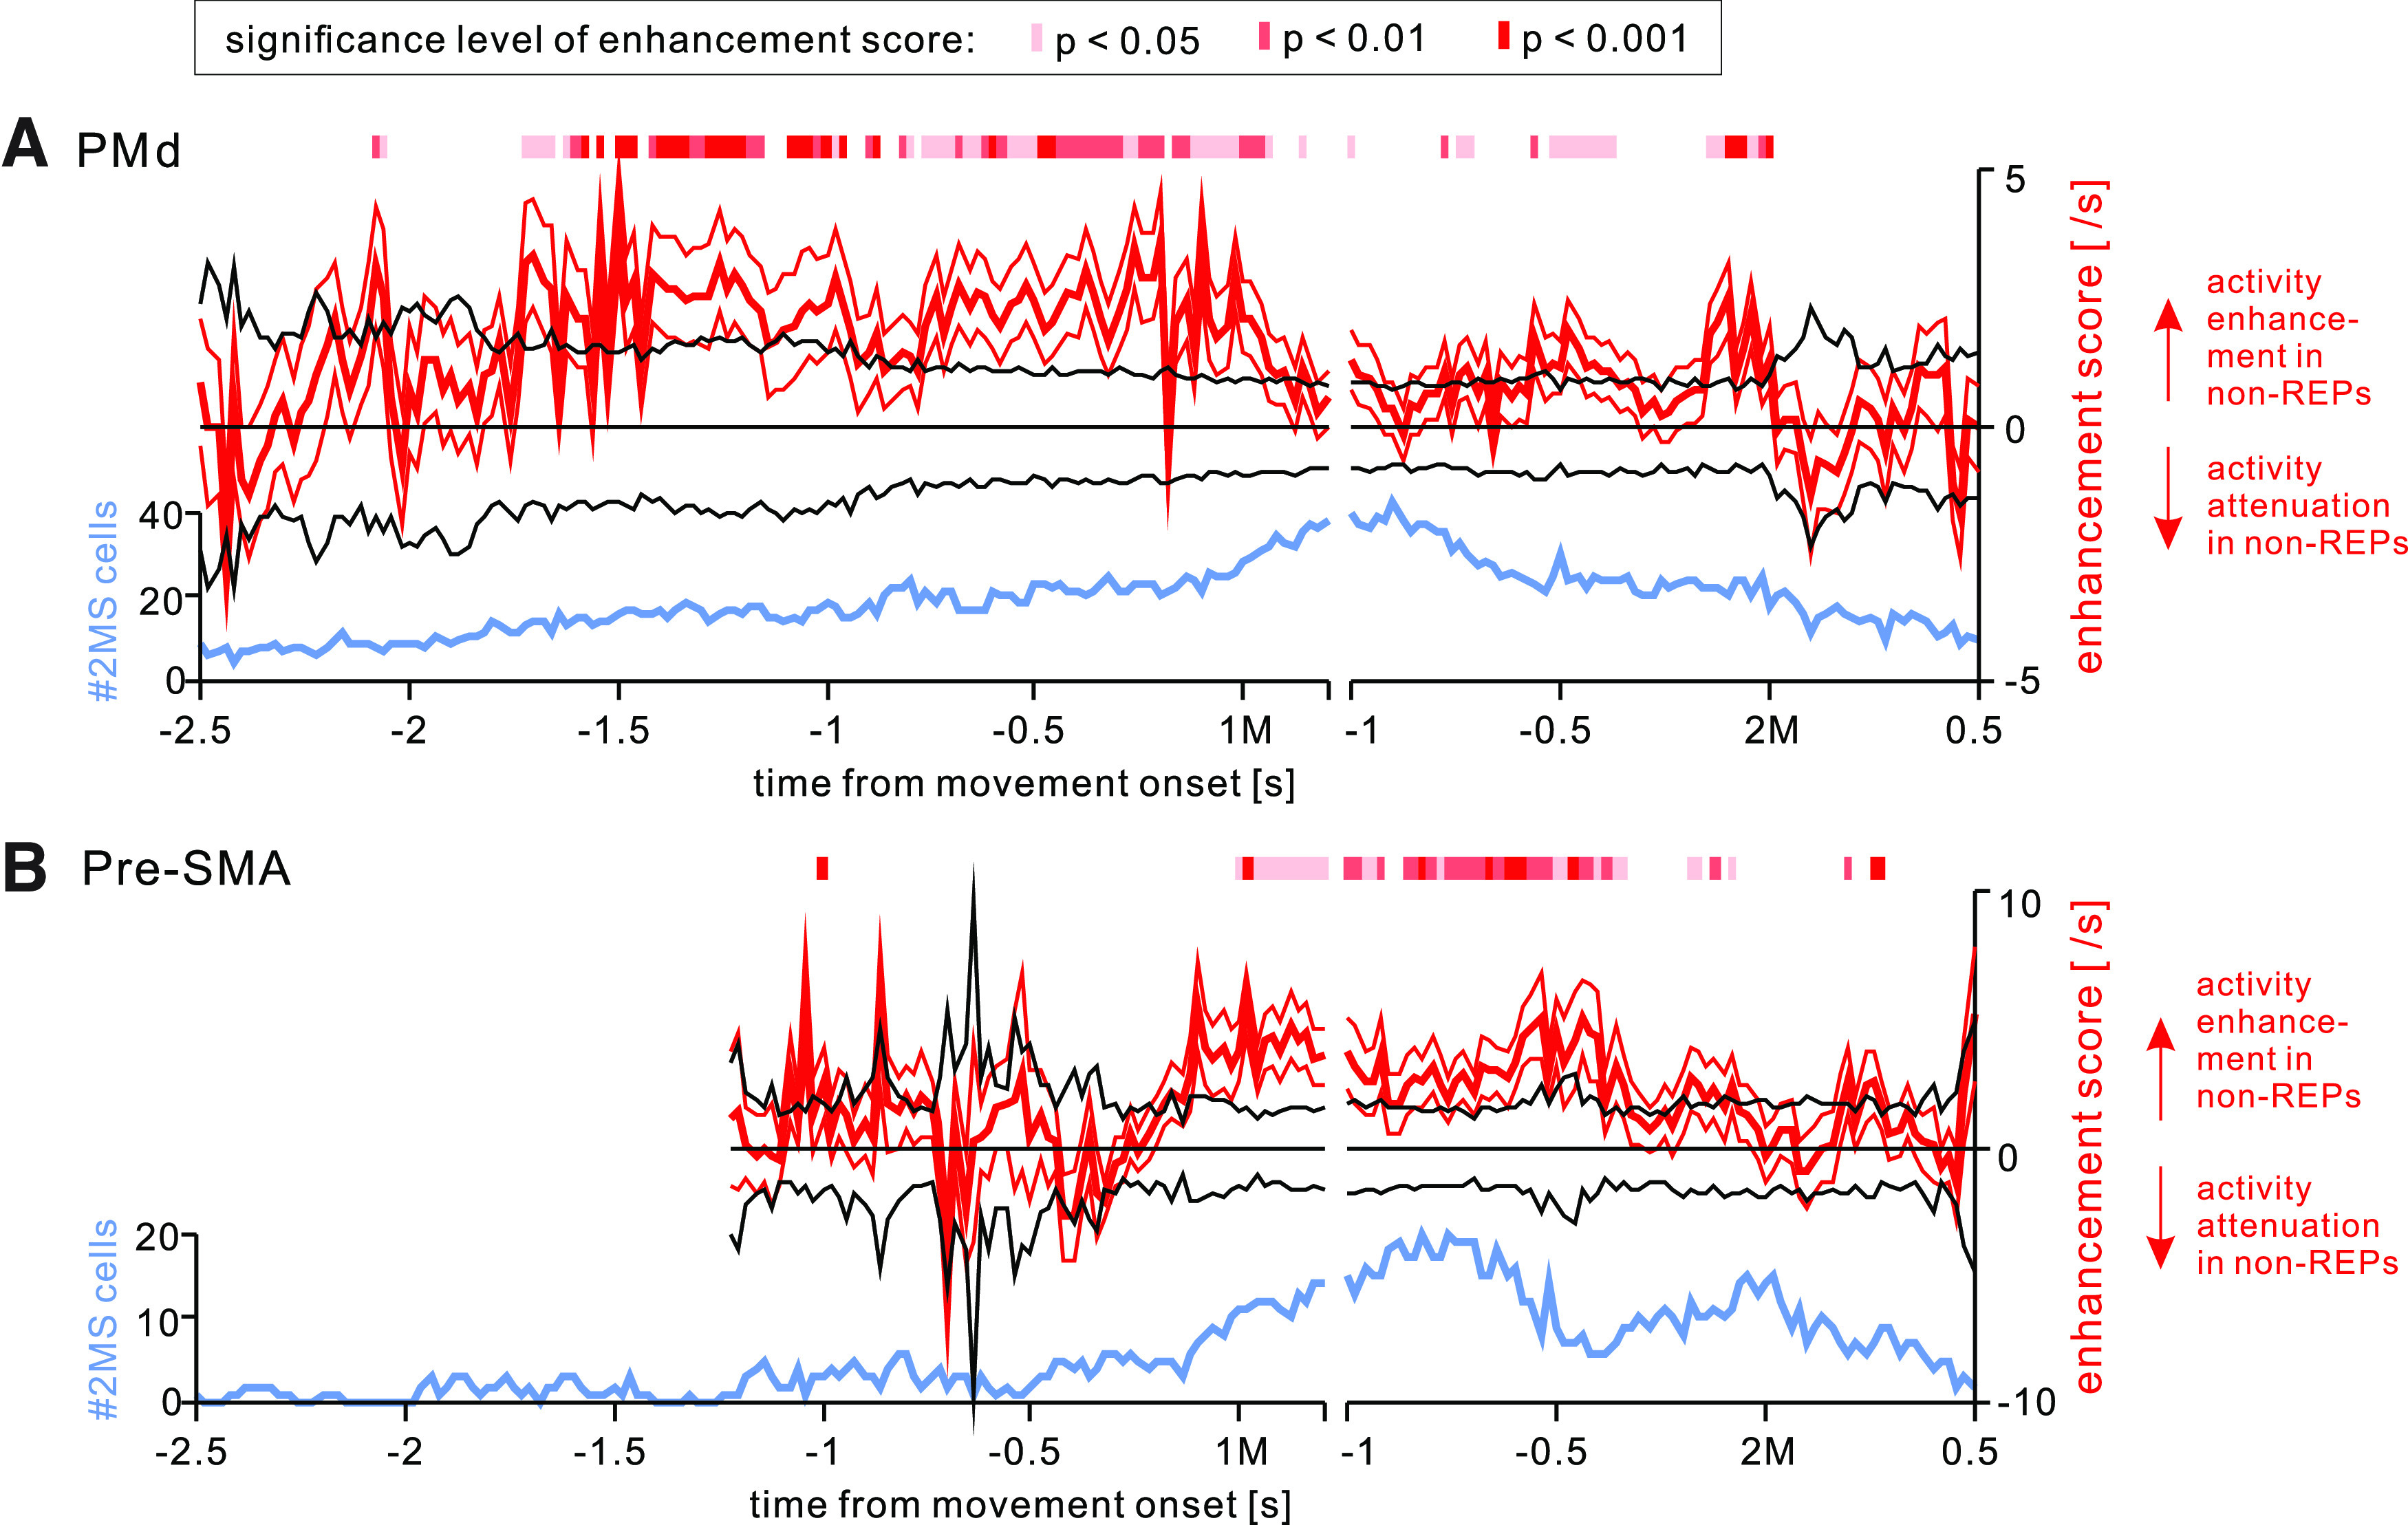
Figure 12.

Activity enhancement in nonrepetition sequences for 2MS cells. Time courses of the activity enhancement score during non-REPs relative to REPs (left vertical axis; thick red trace with 95% confidence limits) in 2MS cells, superimposed on the number of 2MS cells exhibiting 2M-selective activity at each instance (right vertical axis; light blue trace) for (A) PMd and (B) pre-SMA. Black traces on both sides of the horizontal axis indicate the 95% confidence limits of the enhancement score calculated for the REPs. Red segments on each plot show the periods during which the enhancement score in non-REPs was significantly (p < 0.05) greater than that in REPs (i.e., zero) by a two-tailed t test. The density of each red segment indicates the significance level, as shown in the inset in A.
