Figure 13.

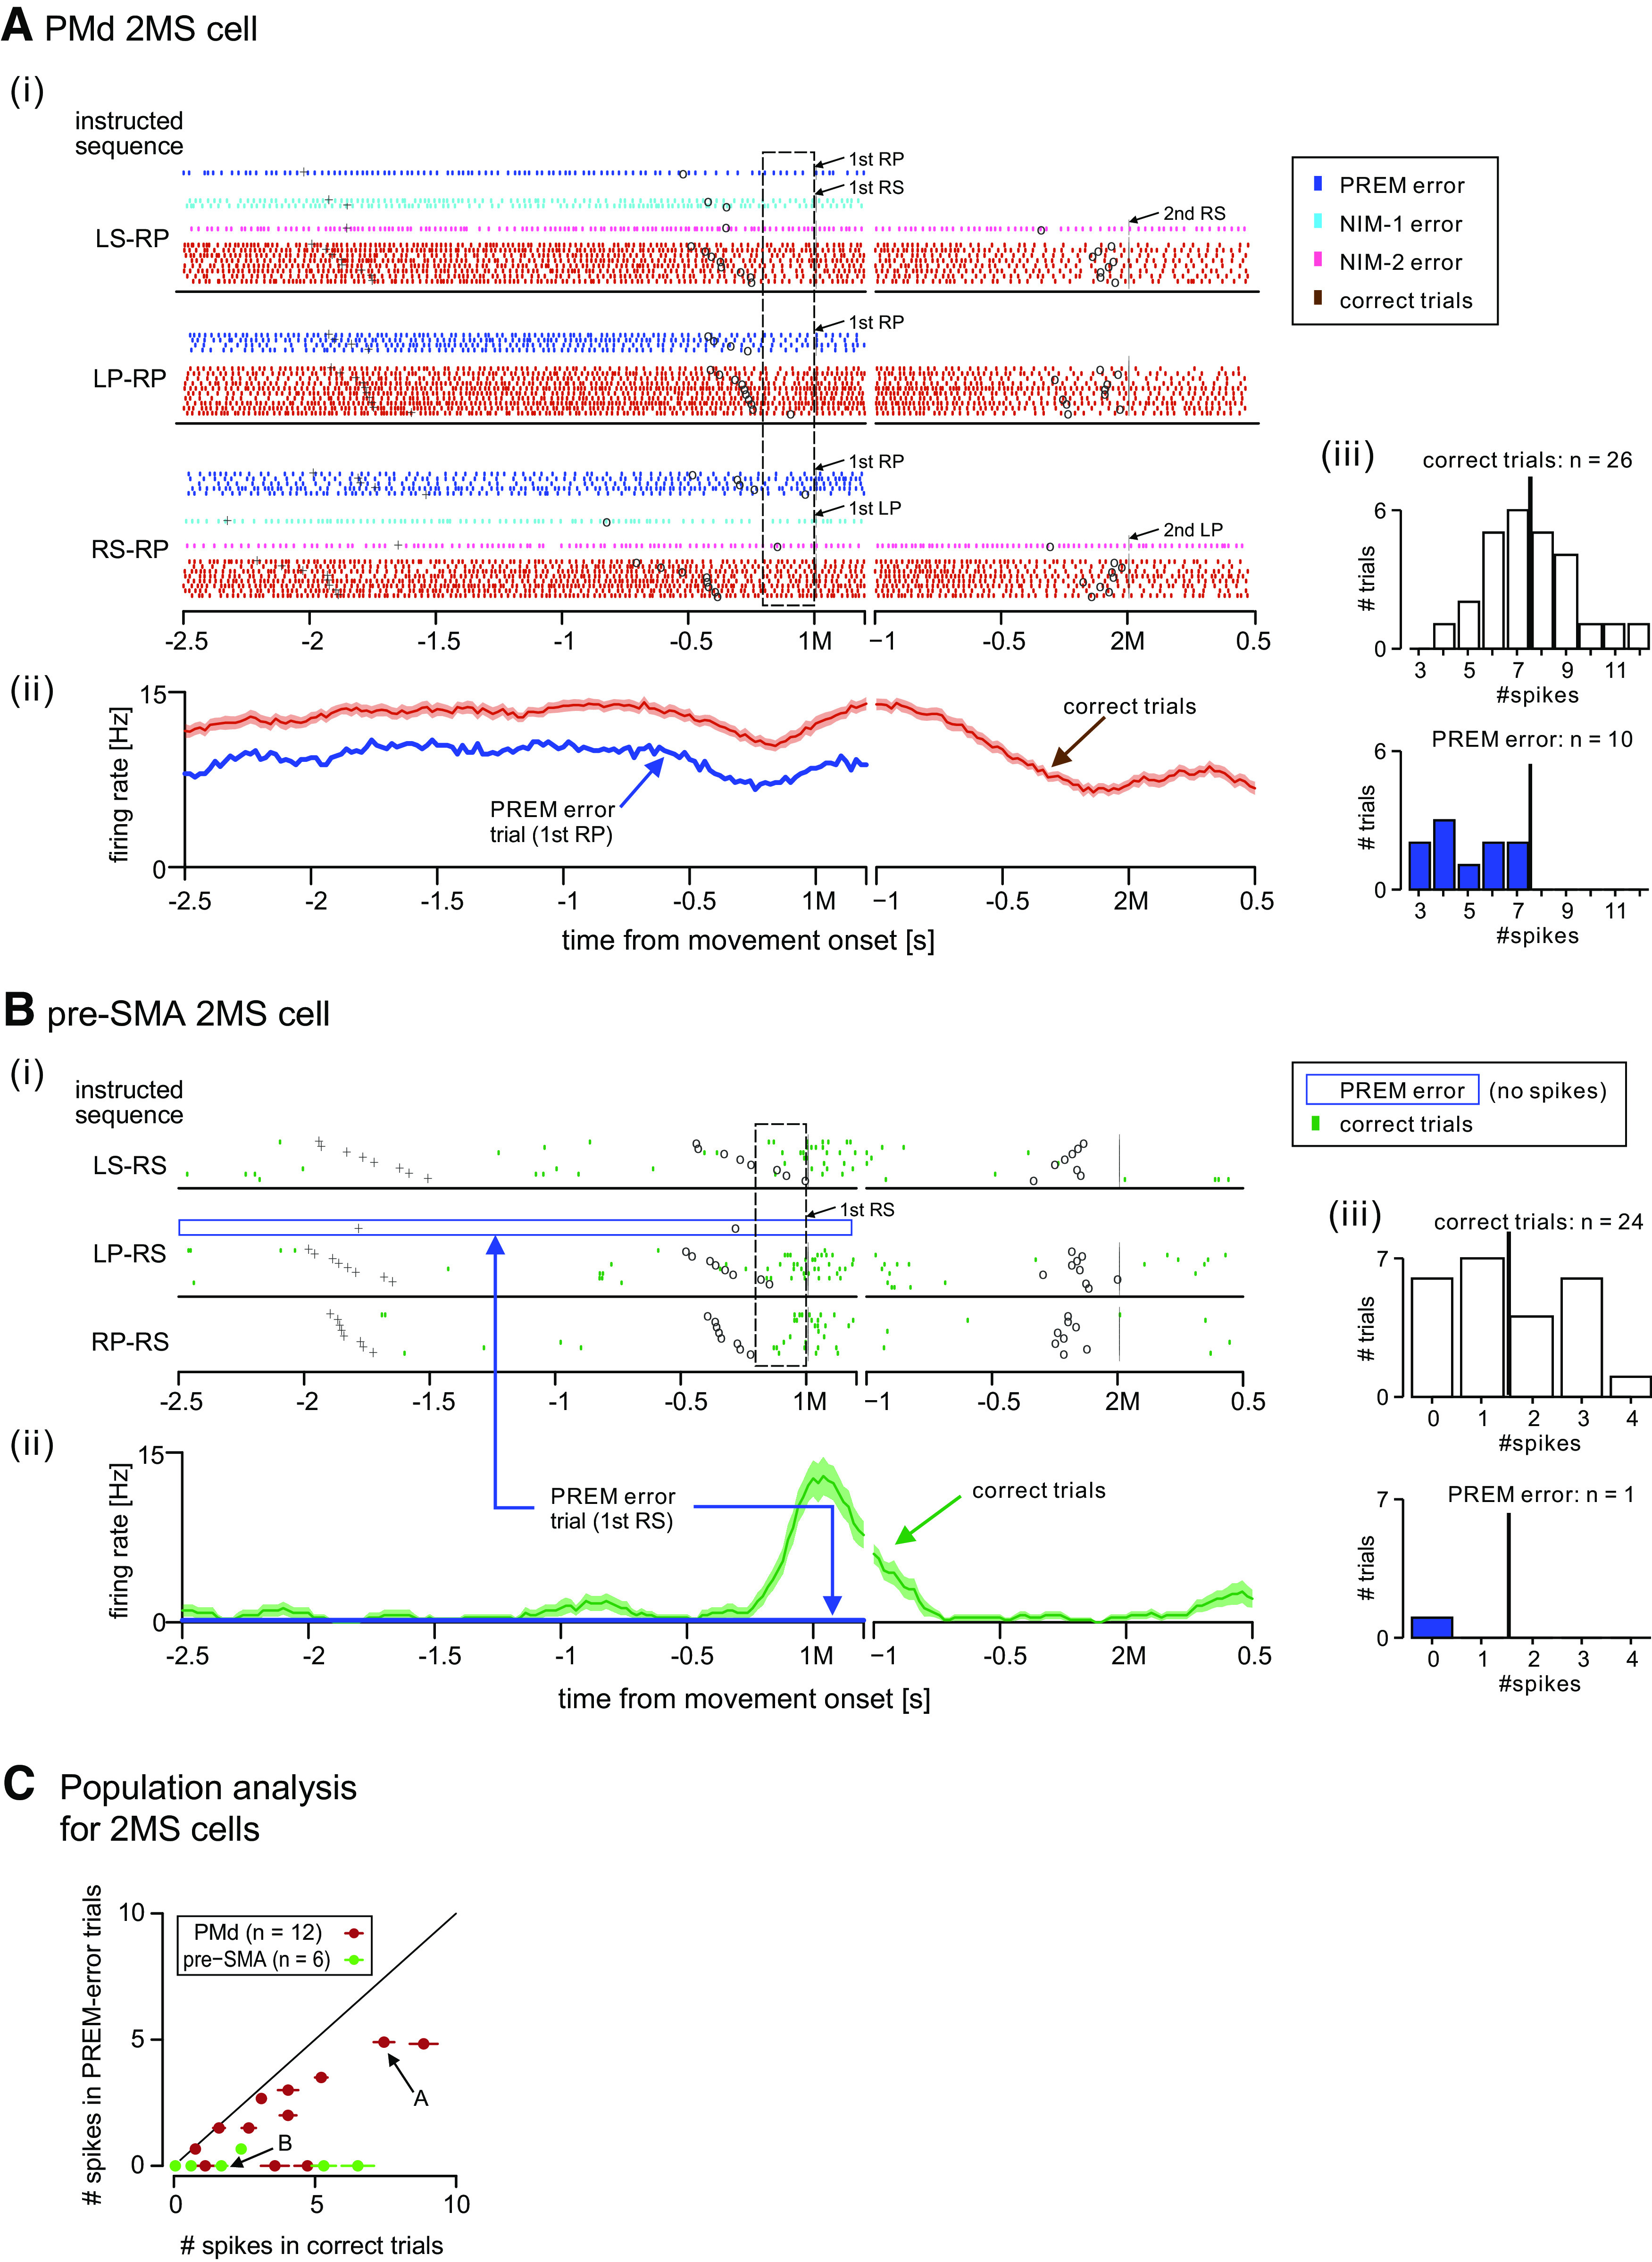
Decrease in 2MS cell activity predicts premature error. A, A comparison of the activity of PMd 2MS cell that appeared in Figure 3 between the error and correct trials. i, Spiking activity of the cell when the monkey had to perform the nonrepetition sequences, including the cell's preferred 2M (RP) from memory, sorted by the 1M. Different types of error trials, as well as correct trials, are color-coded, as shown in the inset. Labels and associated arrows indicate the actual erroneous movements and when they occurred. The dashed rectangle indicates the first premovement period. ii, Time courses of the mean firing rate in correct trials with SE (brown trace) and that in PREM error trials (blue). iii, Distribution of spike counts observed during the first premovement period in the correct (top) and PREM-error (bottom) trials. The thick vertical bar indicates the mean spike count in the correct trials. B, Activity of pre-SMA 2MS cell that was shown in Figure 8A, when the monkey had to perform nonrepetition sequences, including the cell's preferred movement (RS) from memory. As shown by the blue open rectangle in i, there was no spiking activity before the monkey prematurely performed RS. The other display formats are the same as those in A. C, Comparison of activity during first premovement period between correct trials and PREM errors. For each 2MS cell in PMd (brown) and pre-SMA (green), the mean spike count in PREM errors is plotted against that in correct trials. The horizontal segment superimposed on each symbol indicates SEM spike count in correct trials. SEs for the PREM errors are not presented because the error typically happened only once or twice while recoding a cell. Arrows indicate the cells shown in A, B.
