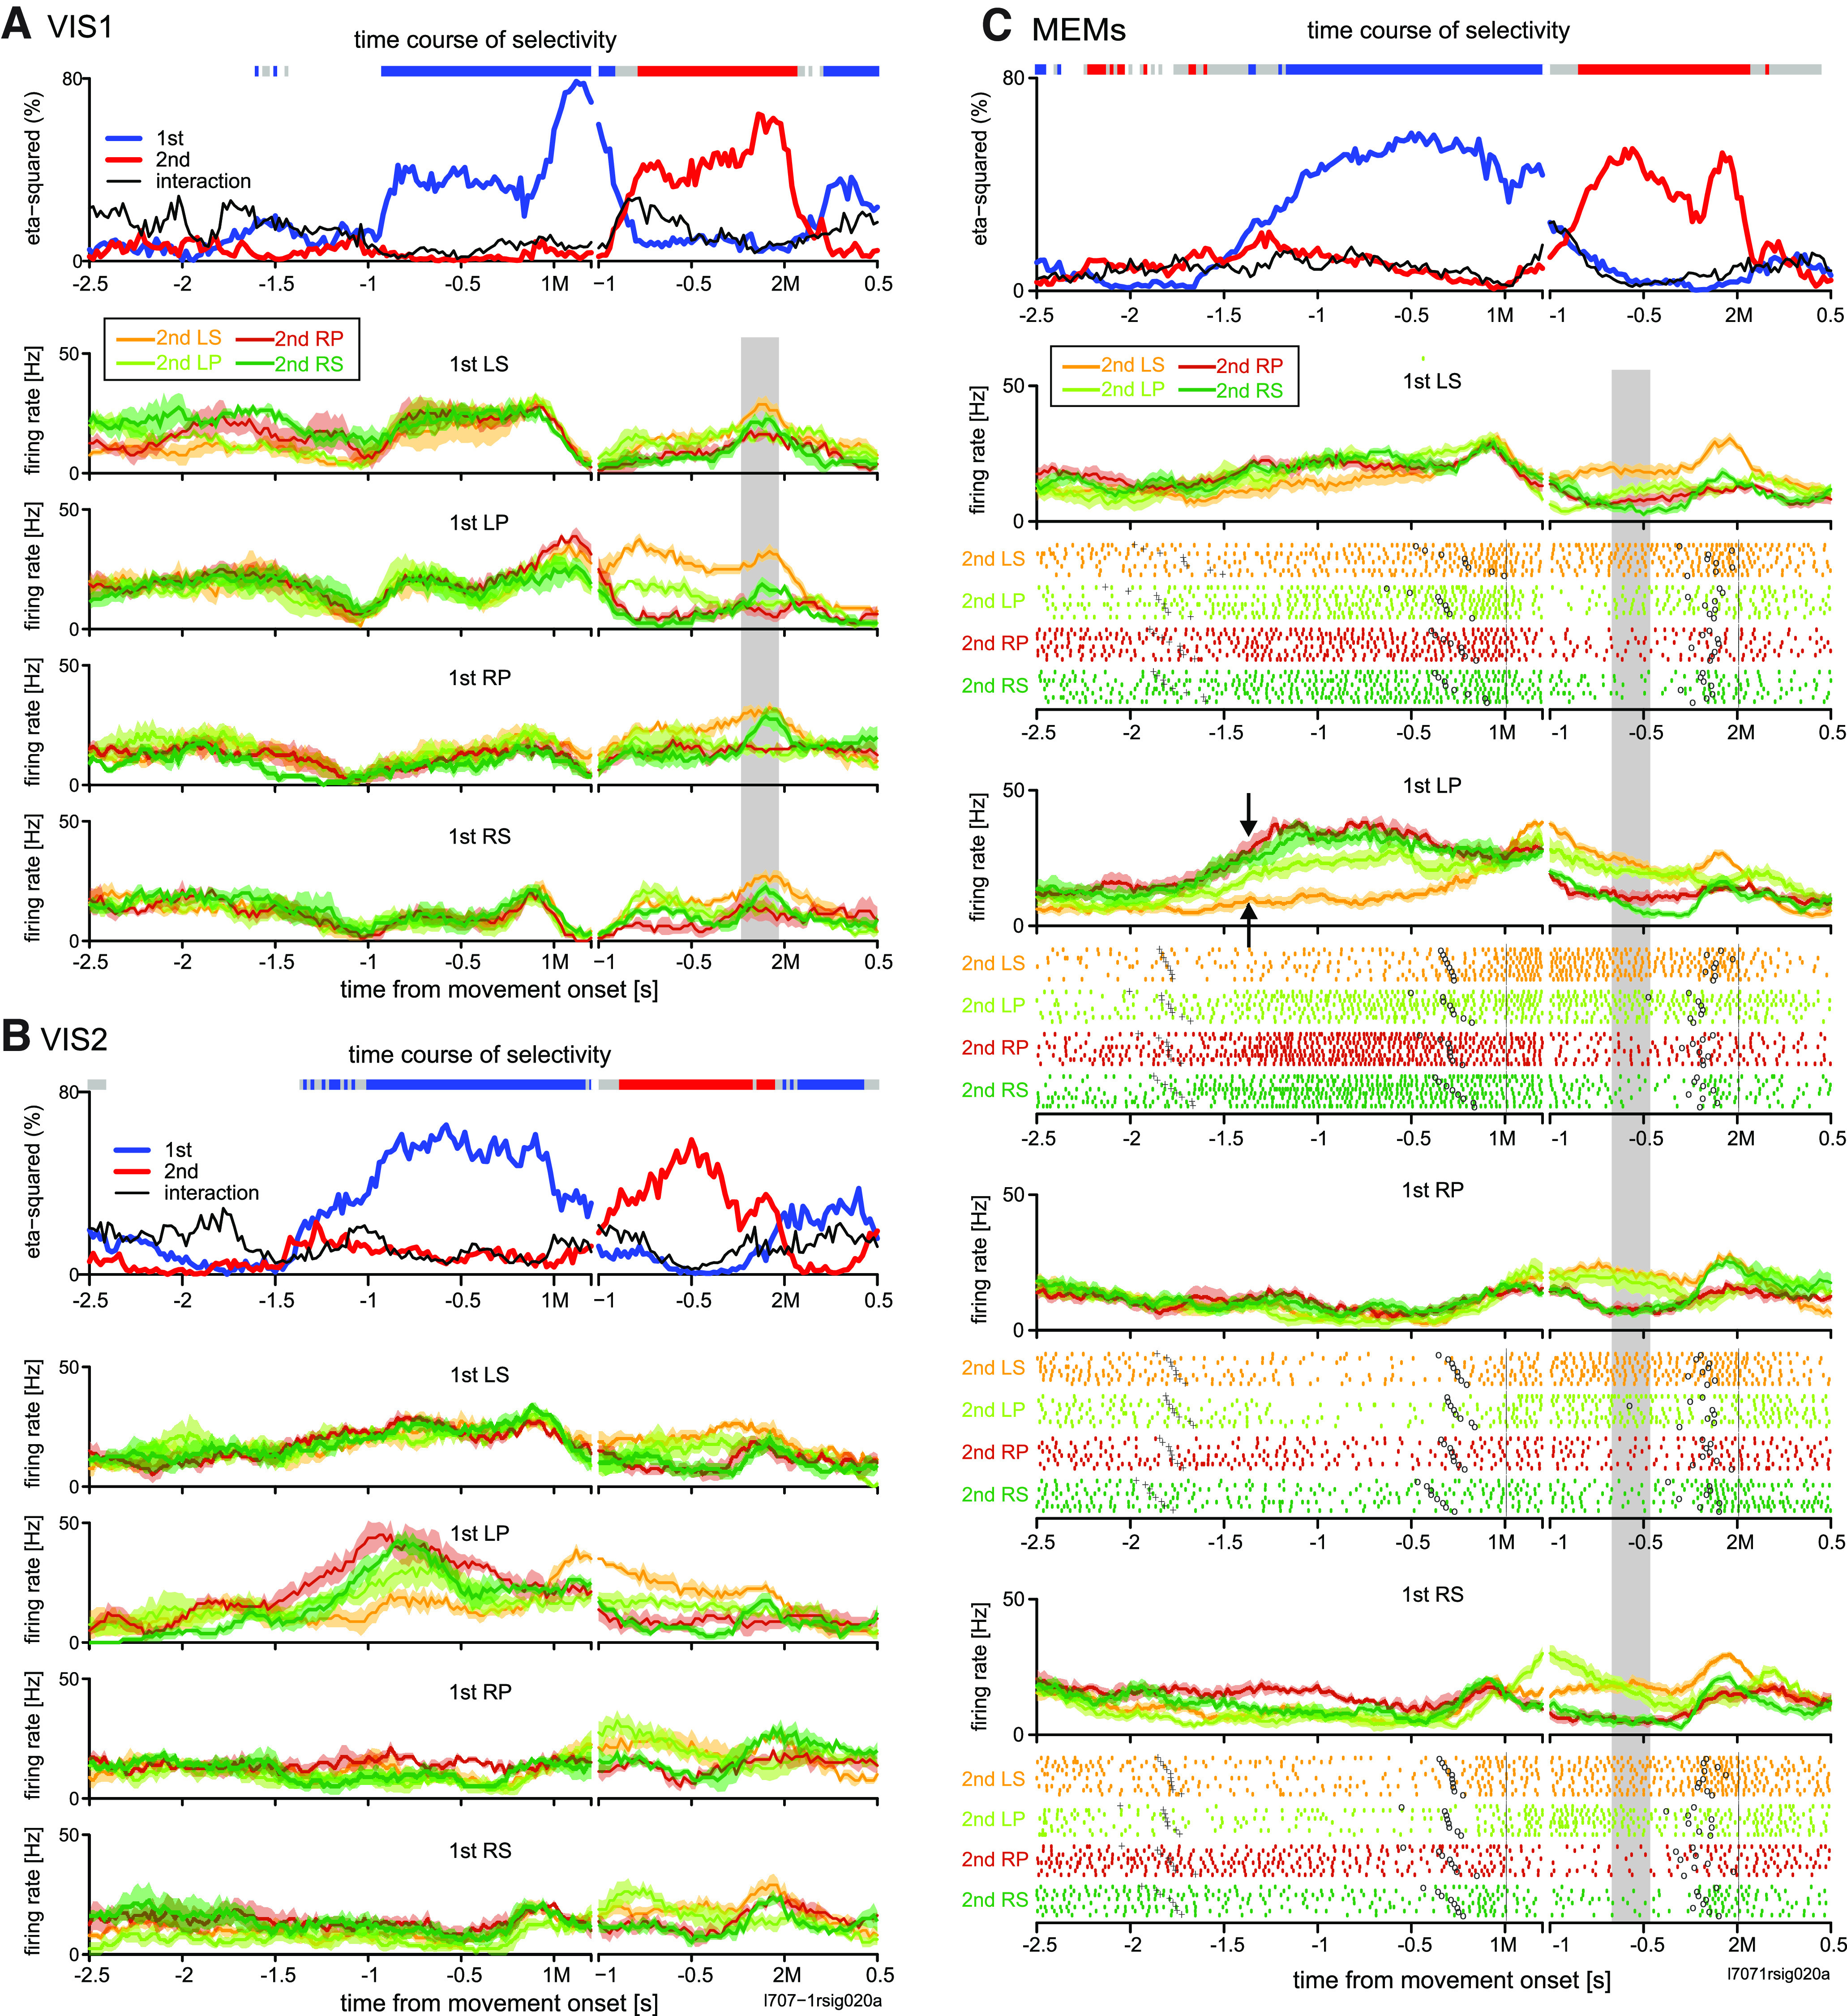
Figure 4.

Activity transition in example RNS cell in PMd. A–C show the activity in the first (A), second visually guided trials (B), and memory-guided trials (C), using the same format as that shown in Figure 2A–C. Paired arrows in C indicate the range of different activity levels with respect to 2M that occurred before 1M (LP).
