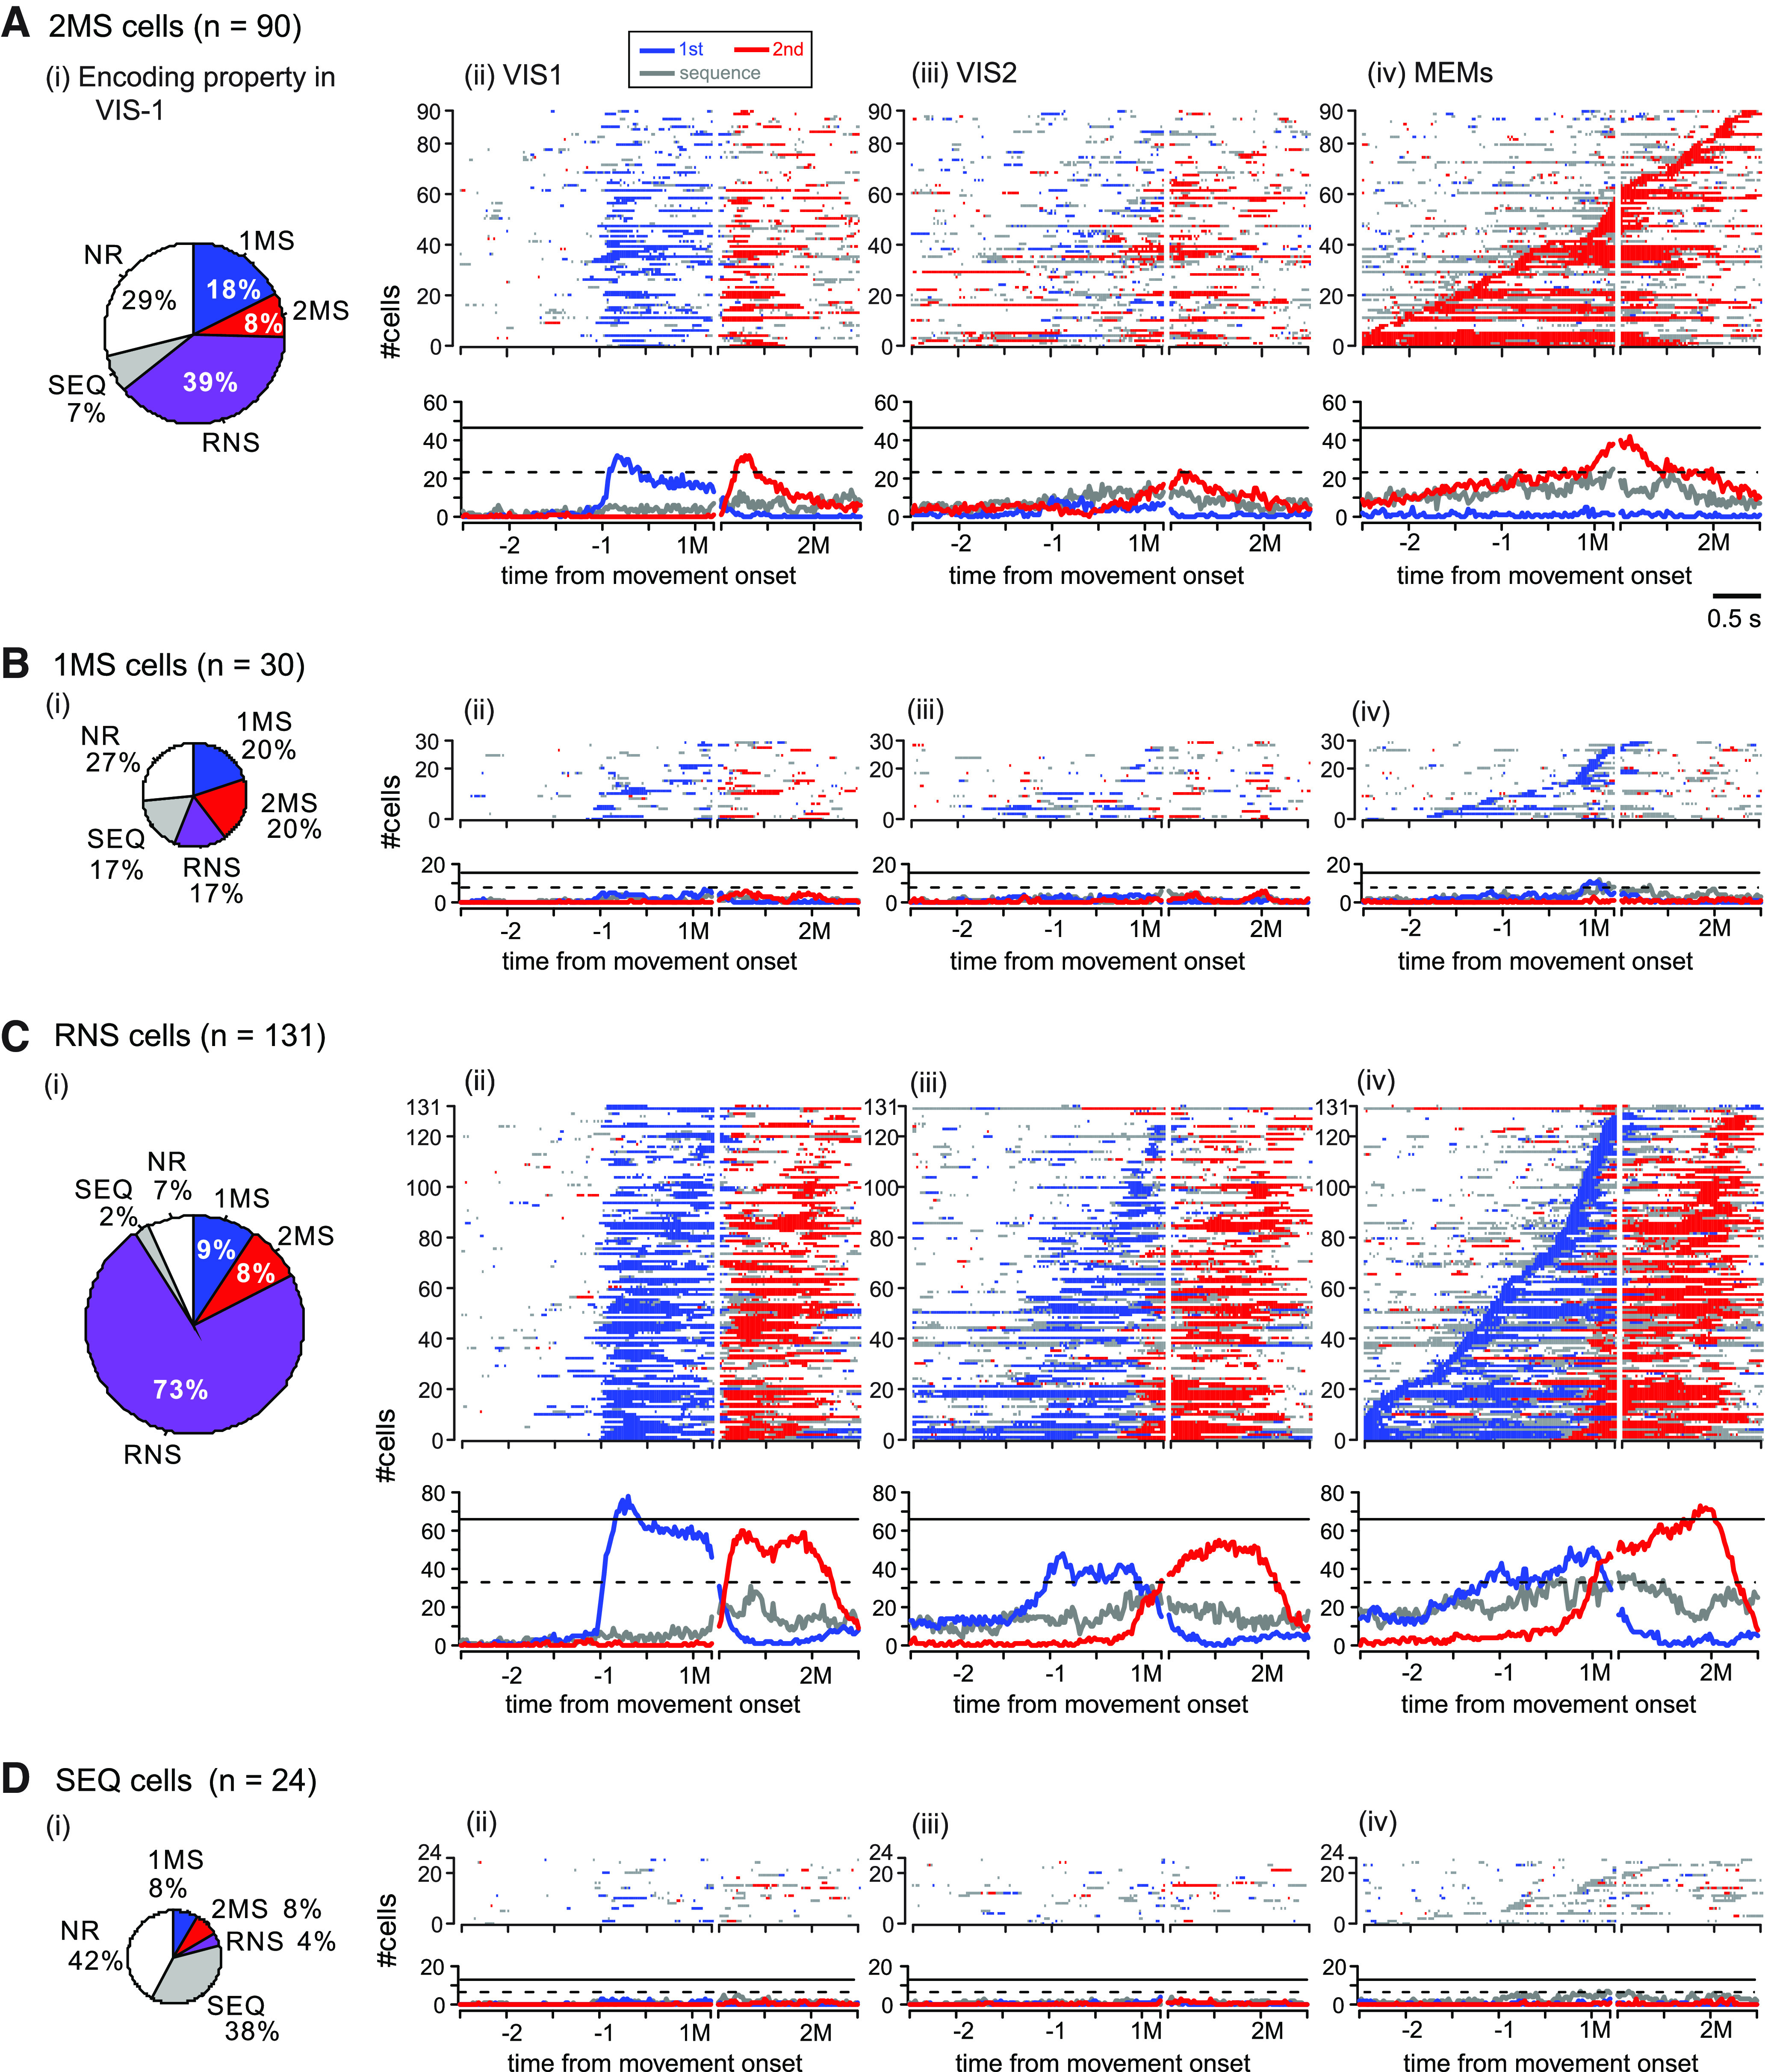
Figure 5.

Population activity of task-related cells in PMd. A, Population activity of the 2MS cells. i, Subdivision of the 2MS cells according to the encoding property in VIS1. 1MS, 1M-specific; 2MS, 2M-specific; RNS, rank nonspecific; SEQ, sequence only selective; NR, task nonrelated. ii–iv, Top row, Phase diagram showing the temporal profile of selectivity detected among the 2MS cells during the (ii) VIS1, (iii) VIS2 (iii), and (iv) MEMs. Activity profiles of individual cells are color-coded, as shown in the inset; each row represents data for a single cell. Cell activity was sorted by the onset of 2M-selective activity that was determined in the MEMs and arranged for display in the order of its first appearance (from bottom to top). Bottom row, Time course of the number of cells in each instance that exhibited 1M-selective activity (red trace), 2M-selective activity (blue trace), and sequence-selective activity (gray trace) are plotted during the analysis period. The horizontal lines indicate 25% (dashed line) and 50% (solid line) of all 2MS cells. For display purposes, we adjusted the variation of the interval between the two movements by inserting a gap between 200 ms after the 1M onset (1M) and 1 s before the 2M onset (2M). B–D, Population activity of (B) 1MS, (C) RNS, and (D) SEQ cells. The basic display format is the same as A, except that cell activity in B, C was sorted by the onset of 1M-selective activity, and the activity in D was sorted by the onset of sequence-selective activity, both of which were determined in MEMs. See Figure 6 for the population activity aligned with cue onsets in VIS1 and VIS2.
