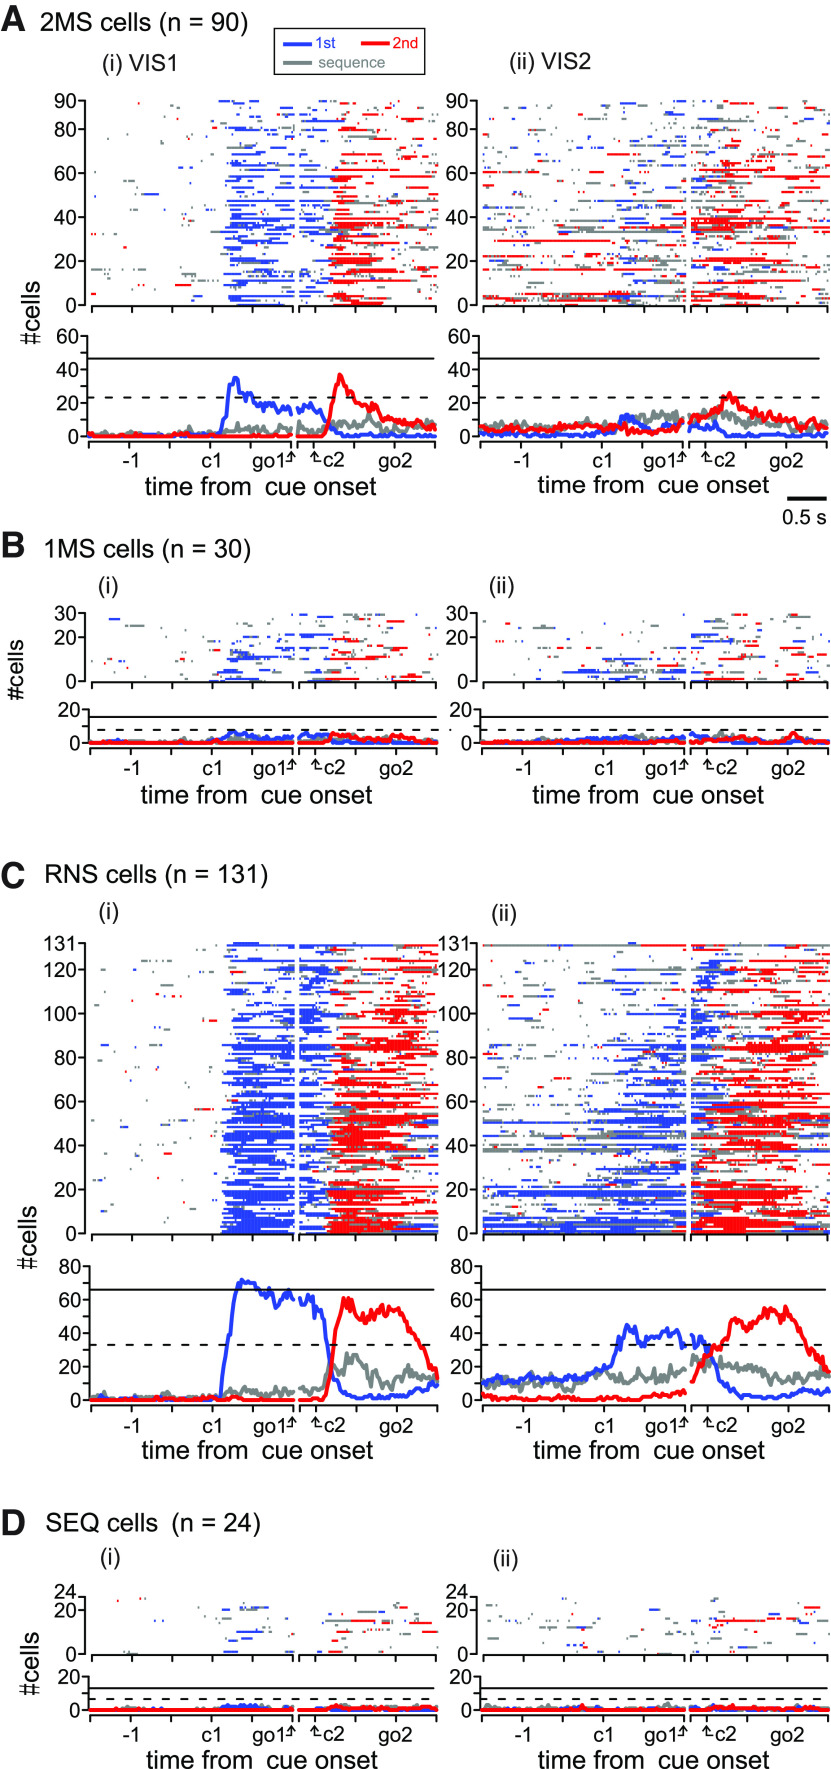
Figure 6.
Population activity of PMd cells aligned with visual cue onsets. A–D show population activity of 2MS (A), 1MS (B), RNS (C) and SEQ cells (D) during the first (i) and second (ii) visually-guided trials. The basic display format is similar to that shown in Figure 5, ii, iii. For display purposes, we adjusted the variation of the interval between the presentations of the first and second cues (c1, c2) by inserting a gap between the first GO signal (go1) and 200 ms before the second cue presentation. go2, second GO signal.

