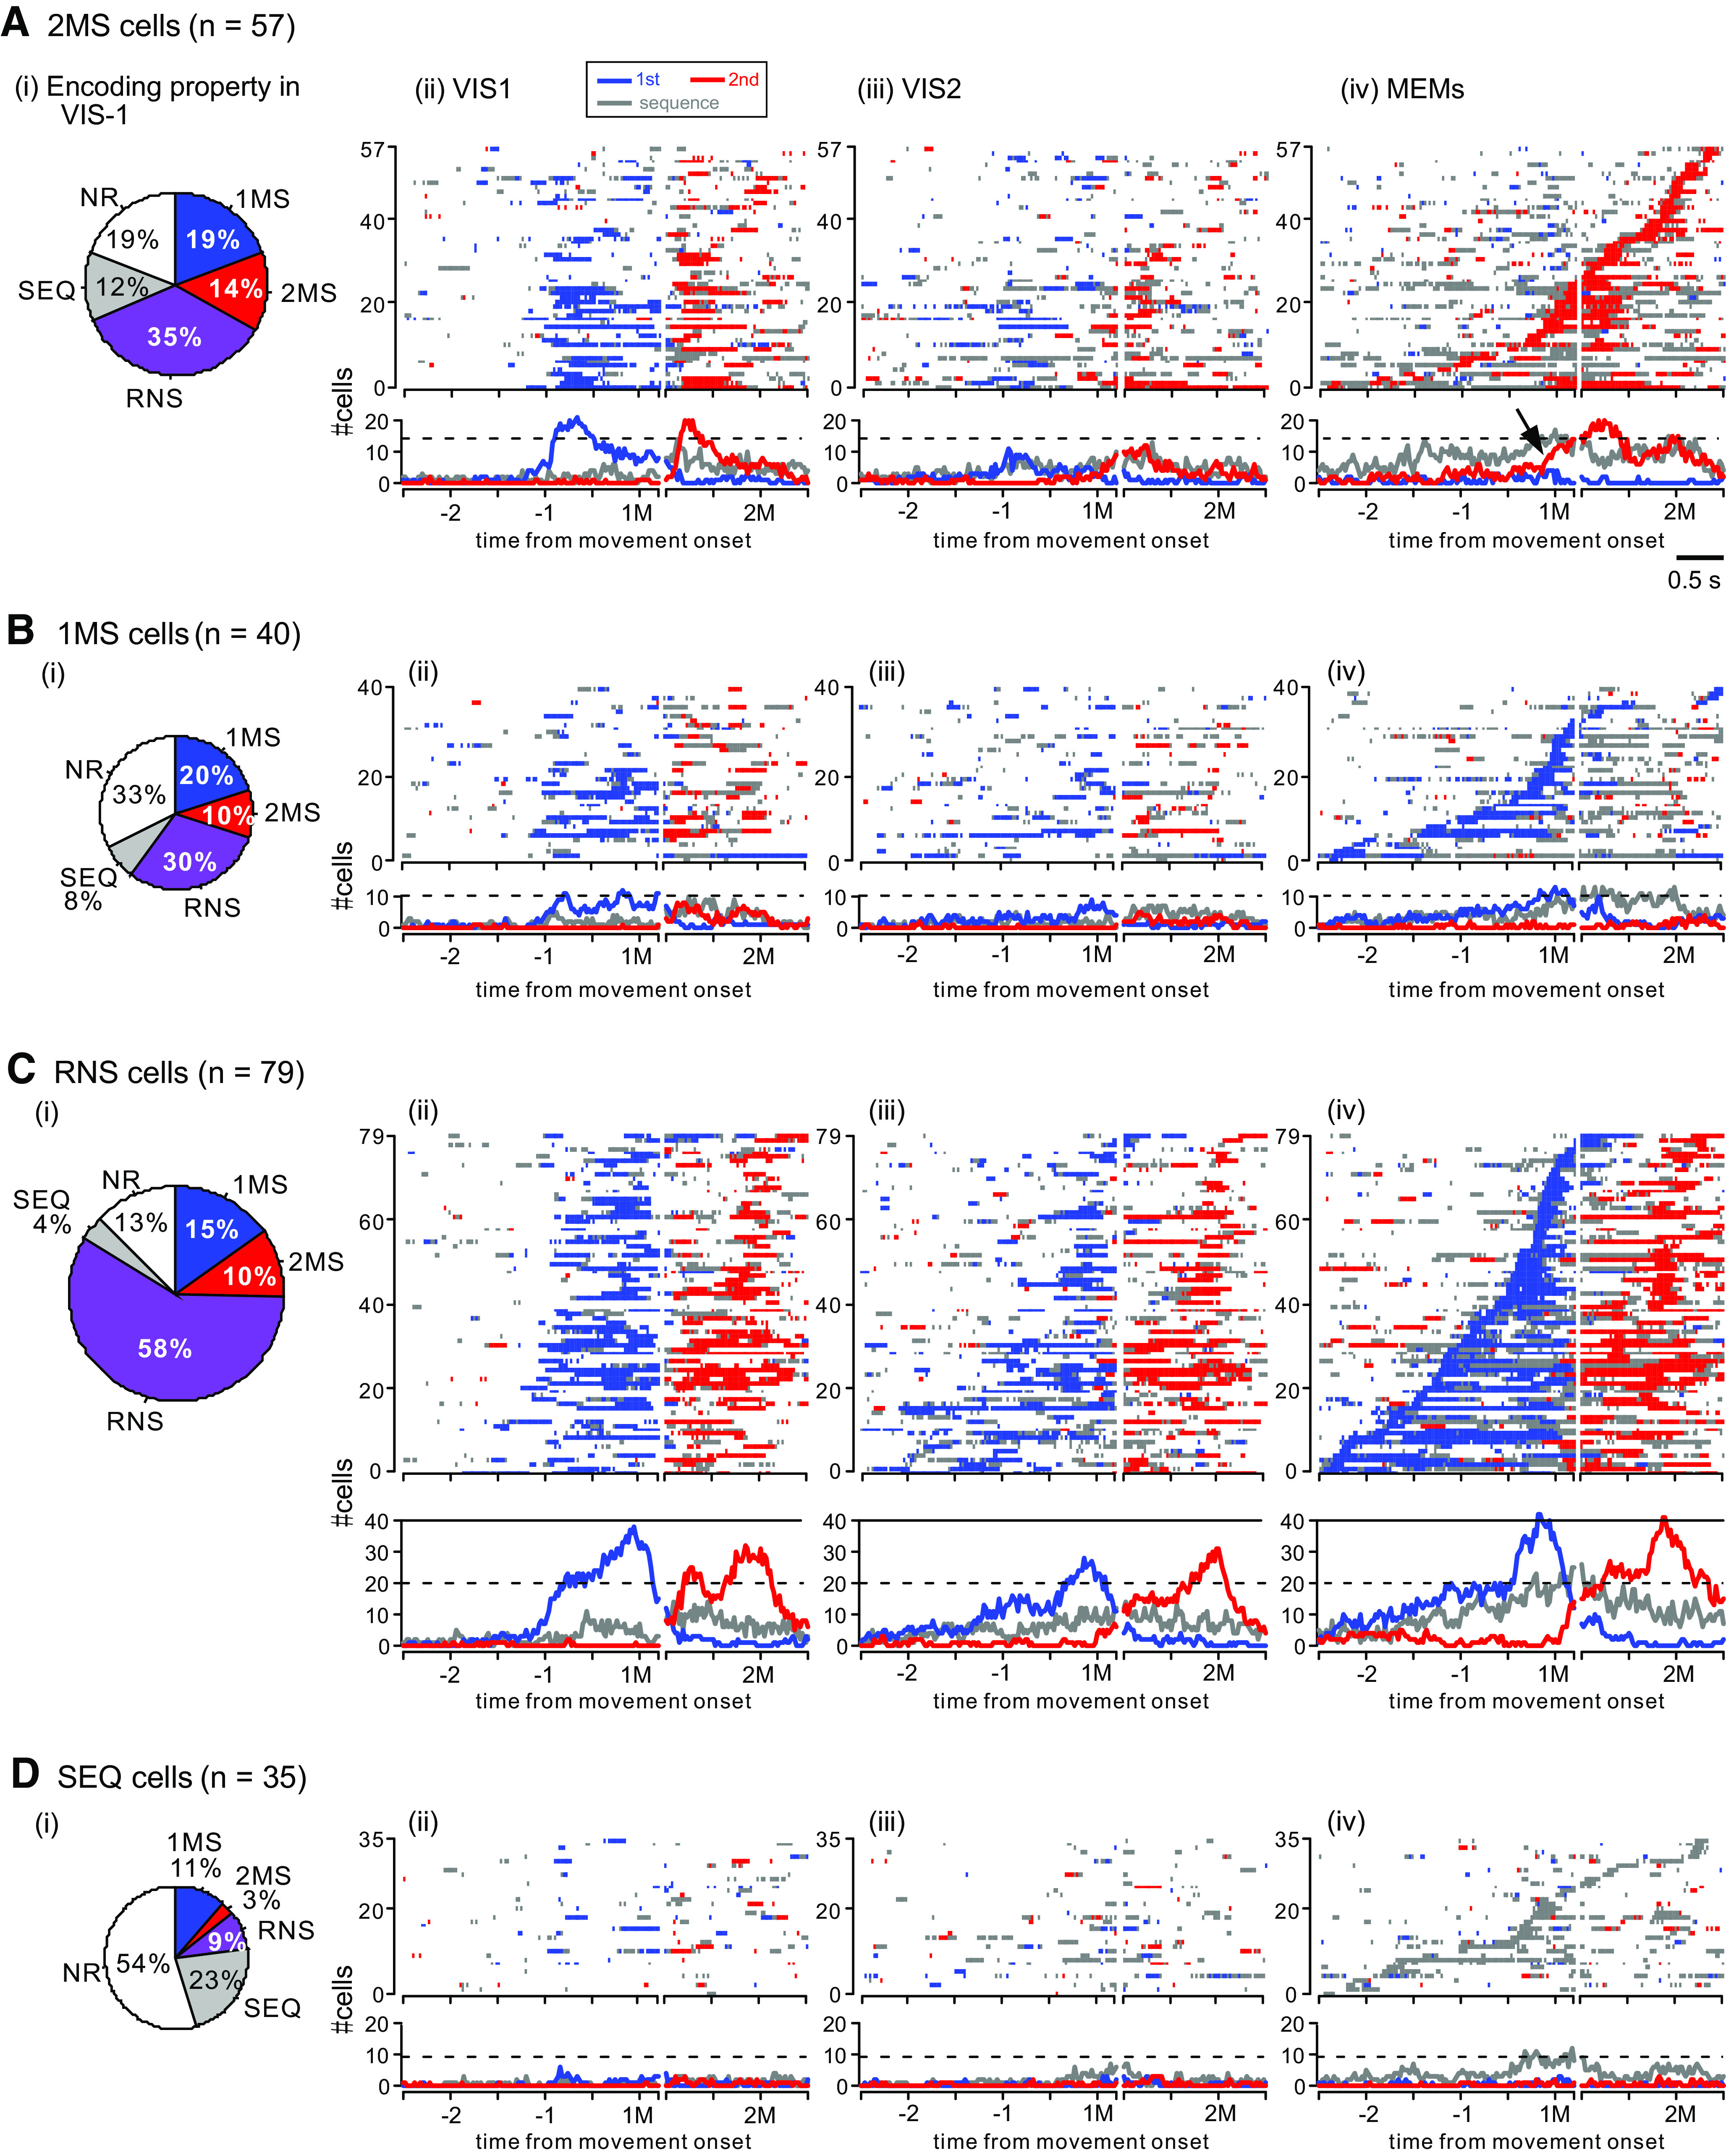
Figure 9.

Population activity of task-related cells in pre-SMA. A–D show population activity of 2MS (A), 1MS (B), RNS (C) and SEQ cells (D) using the same format as that shown in Figure 5A–D. The arrow in A, iv indicates an abrupt increase in the cells exhibiting 2M selectivity. See Figure 10 for the population activity aligned with cue onsets in VIS1 and VIS2.
